November 28, 2017
ADK Adcare Health Systems and Support
Study chart, the price keeps falling down; bearish. The price action keeps testing the support.
Finally goes below one dollar.
The following chart is plot by AmiBroker charting software. AmiBroker is a powerful charting software.
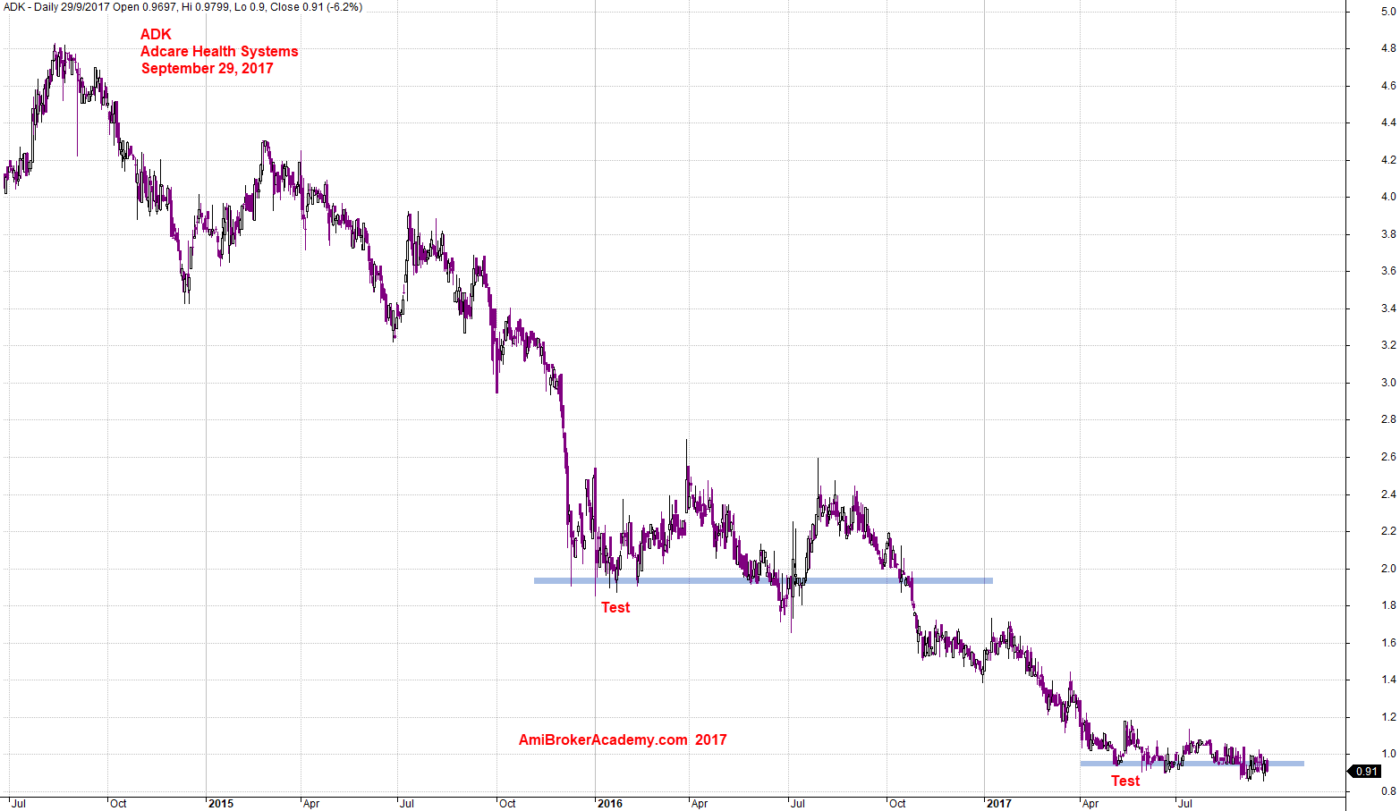
September 29, 2017 Adcare Health Systems and Support
ADI Analog Devices Inc and ADK Adcare Health Systems Correlation
ADI Bullish, ADK Bearish. See chart for more.
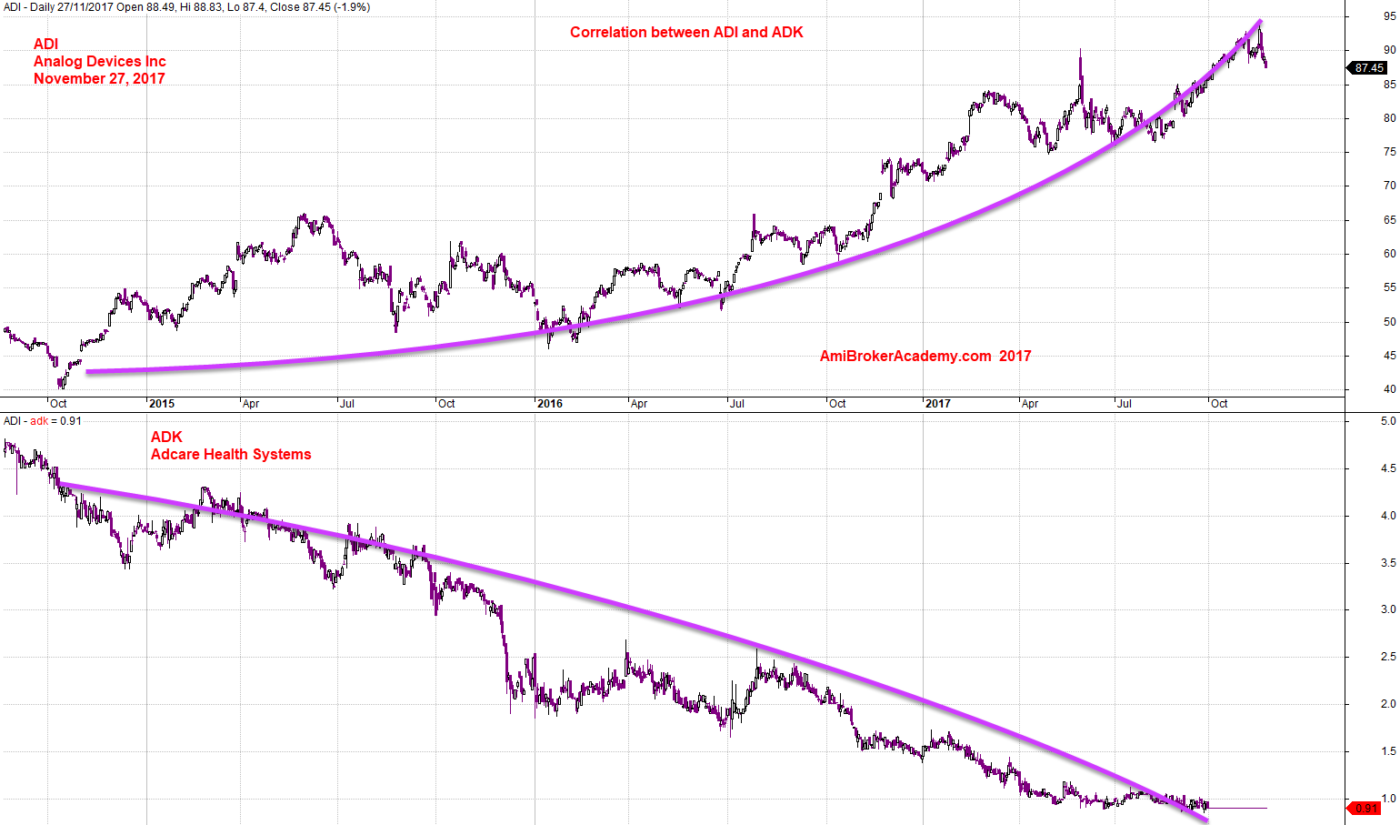
November 27, 2017 Analog Devices and Adcare Health Systems Correlation
Moses
AmiBrokerAcademy.com
Disclaimer
The above result is for illustration purpose. It is not meant to be used for buy or sell decision. We do not recommend any particular stocks. If particular stocks of such are mentioned, they are meant as demonstration of Amibroker as a powerful charting software and MACD. Amibroker can program to scan the stocks for buy and sell signals.
These are script generated signals. Not all scan results are shown here. The MACD signal should use with price action. Users must understand what MACD and price action are all about before using them. If necessary you should attend a course to learn more on Technical Analysis (TA) and Moving Average Convergence Divergence, MACD.
Once again, the website does not guarantee any results or investment return based on the information and instruction you have read here. It should be used as learning aids only and if you decide to trade real money, all trading decision should be your own.