February 1, 2018
Singapore Stock Analysis
Powerful Chart Software – AmiBroker
The following chart is produced using AmiBroker charting software. It is a powerful chart software. You plot the stocks you are interested all in one chart, as long as you still could read them. See chart below. Thereafter slowly climb up, step by step.
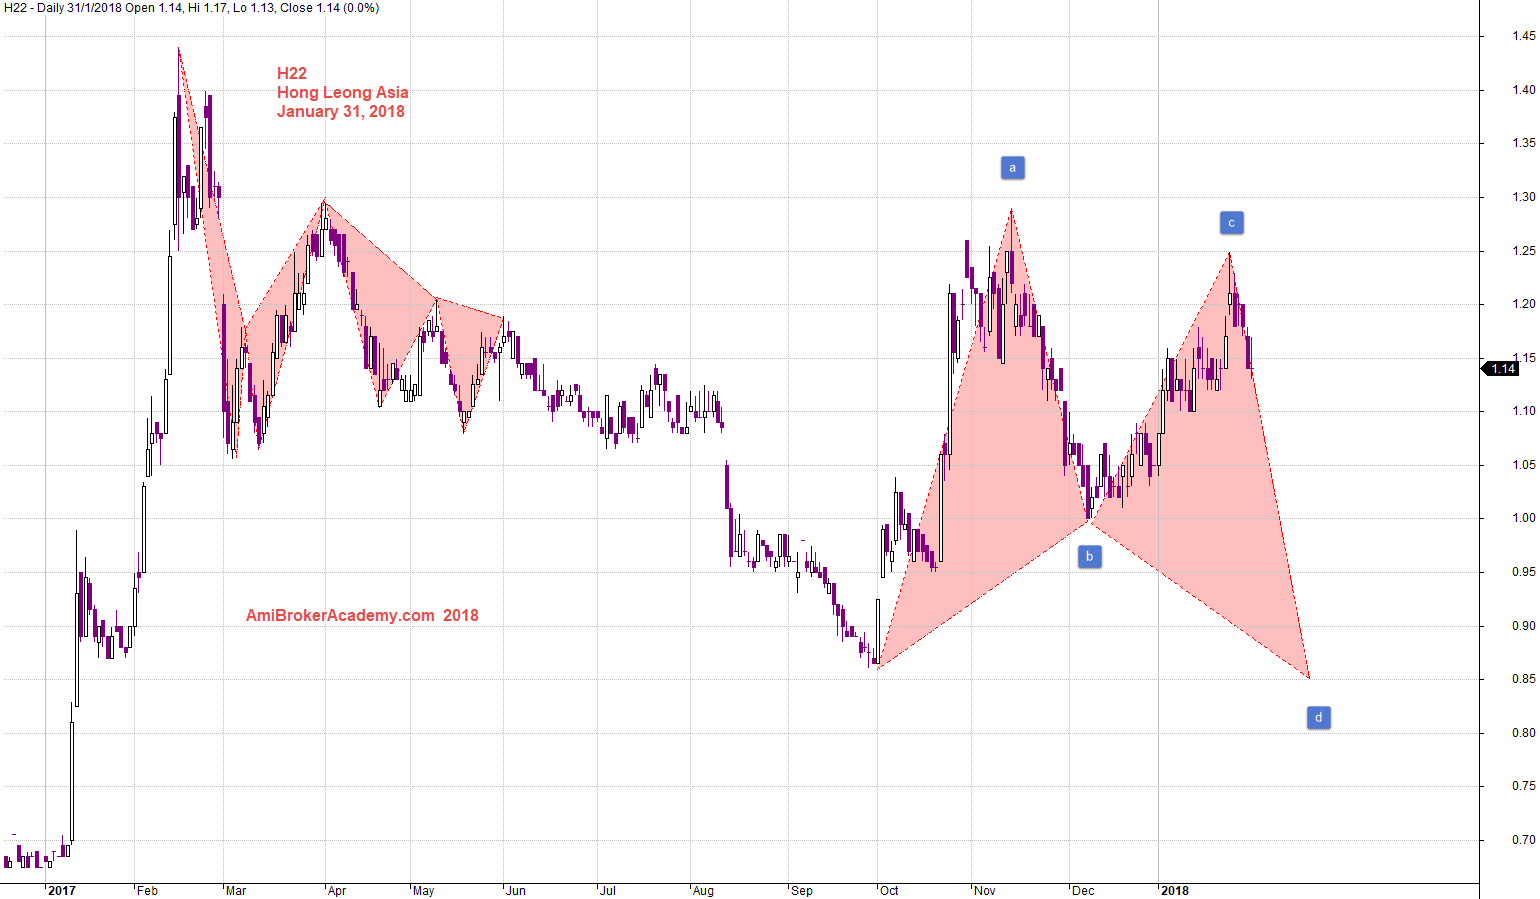
H22 Hong Leong Asia and ABCD Pattern
Study Hong Leong Asia chart, point c is lower than point a, if cd leg equal to ab leg, the stock price may be lower than 90 cents. But all set up can fail, manage your risk. Let’s check the chart again using other TA tools.
Have fun!
January 31, 2018 Hong Leong Asia and ABCD
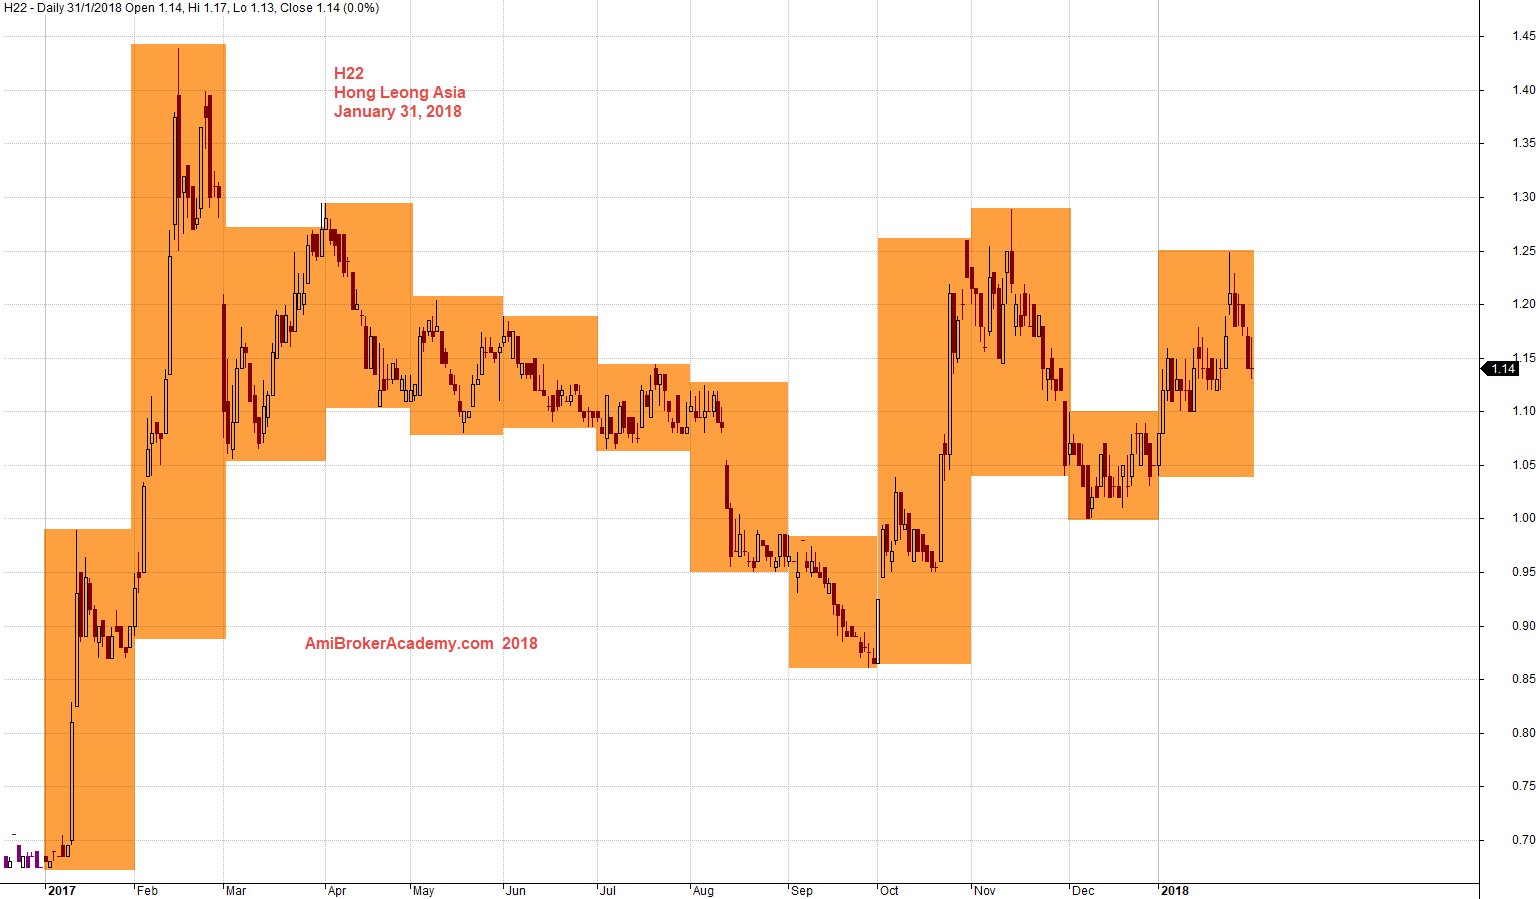
H22 and Month High Low
See chart stock price try to retest 1.30 but fall short. Stock price did not give up, retest again, this time the best is only 1.25; getting lower. So, what next? May be in order to have enough strength, the price will deep further. Will see.
January 31, 2018 Hong Leong Asia Month High Low
Moses
AmiBrokerAcademy.com
Disclaimer
The above result is for illustration purpose. It is not meant to be used for buy or sell decision. We do not recommend any particular stocks. If particular stocks of such are mentioned, they are meant as demonstration of Amibroker as a powerful charting software and MACD. Amibroker can program to scan the stocks for buy and sell signals.
These are script generated signals. Not all scan results are shown here. The MACD signal should use with price action. Users must understand what MACD and price action are all about before using them. If necessary you should attend a course to learn more on Technical Analysis (TA) and Moving Average Convergence Divergence, MACD.
Once again, the website does not guarantee any results or investment return based on the information and instruction you have read here. It should be used as learning aids only and if you decide to trade real money, all trading decision should be your own.