15 September 2014
Moses’ Stock Analysis
Chart (Picture) Worth a Thousand Words! Chart Does Not Lie!
The following are good research thesis that why no professor and university are interested in.
1) Why after Great Recession in 2008 the company has never recovered to the previous price level?
2) Why there is always a surge in price below it crashed?
As an example, let have a look at K11.SI.
Keppel Telecommunications & Transportation Ltd is an investment holding company focus on provides integrated services and solutions for logistics and data centre.
But trade what you see, eh!
And again, manage your risk.
Data from 2009, Keppel Tele and Trans, K11.SI weekly.
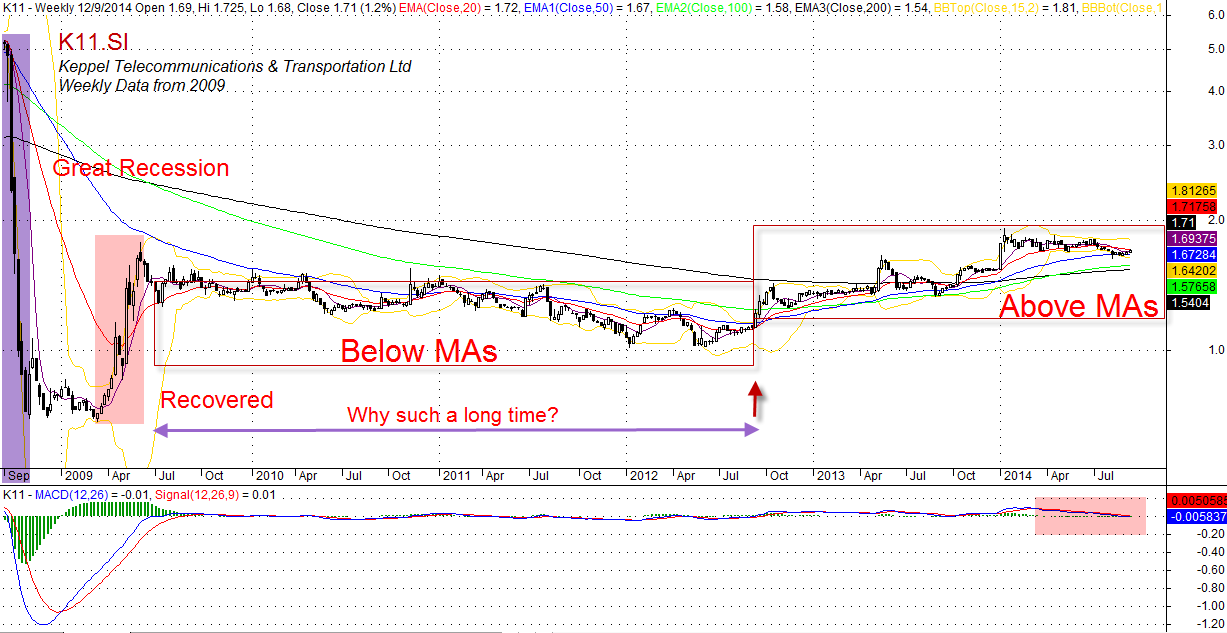
Keppel Telecommunications & Transportation Ltd, K11.SI Weekly from 2009
Read more on other postings:
1) After Great Recession! Moses’ Stock Analysis
2) Why Some Win but Why Some Lost? Moses’ Stock Analysis
Thanks for visiting the site, AmiBrokerAcademy.com.
Moses
DISCLAIMER
Information provided here is of the nature of a general comment only and no intend to be specific for trading advice. It has prepared without regard to any particular investment objectives, financial situation or needs. Information should NOT be considered as an offer or enticement to buy, sell or trade.
You should seek advice from your broker, or licensed investment advisor, before taking any action.
Once again, the website does not guarantee any results or investment return based on the information and instruction you have read here. It should be used as learning aids.
Trading is personal. You are responsible for your own trading decision.
The comment is the author personal experience. There is no intent for your believe and follow.