August 31, 2017
We had studied Singtel, and M1, let see Starhub.
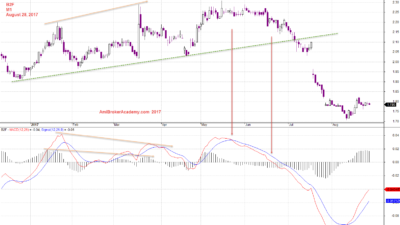
August 28, 2017 M1 and MACD
M1 B2F and MACD Signal
We can share see price keeps forming higher high, but the MACD Histogram forms lower high. Technically the bull is weaker, and the bull trend is running out. True or true?
True or true? The result has proved MACD is correct. The next thing is the price just breakout lower. So, don’t play play (Singlish) agin with the MACD indicator. Respect MACD and trade happily.
CC3 Starhub and Bearish Trend
Share price breakout below $2.7 and retest $2.6, the share price continue to form lower low. See chart for more, picture worth a thousand words.
The support just can not hold the fall.
Oh, yes. Read the analysis without emotion, just for the fact.
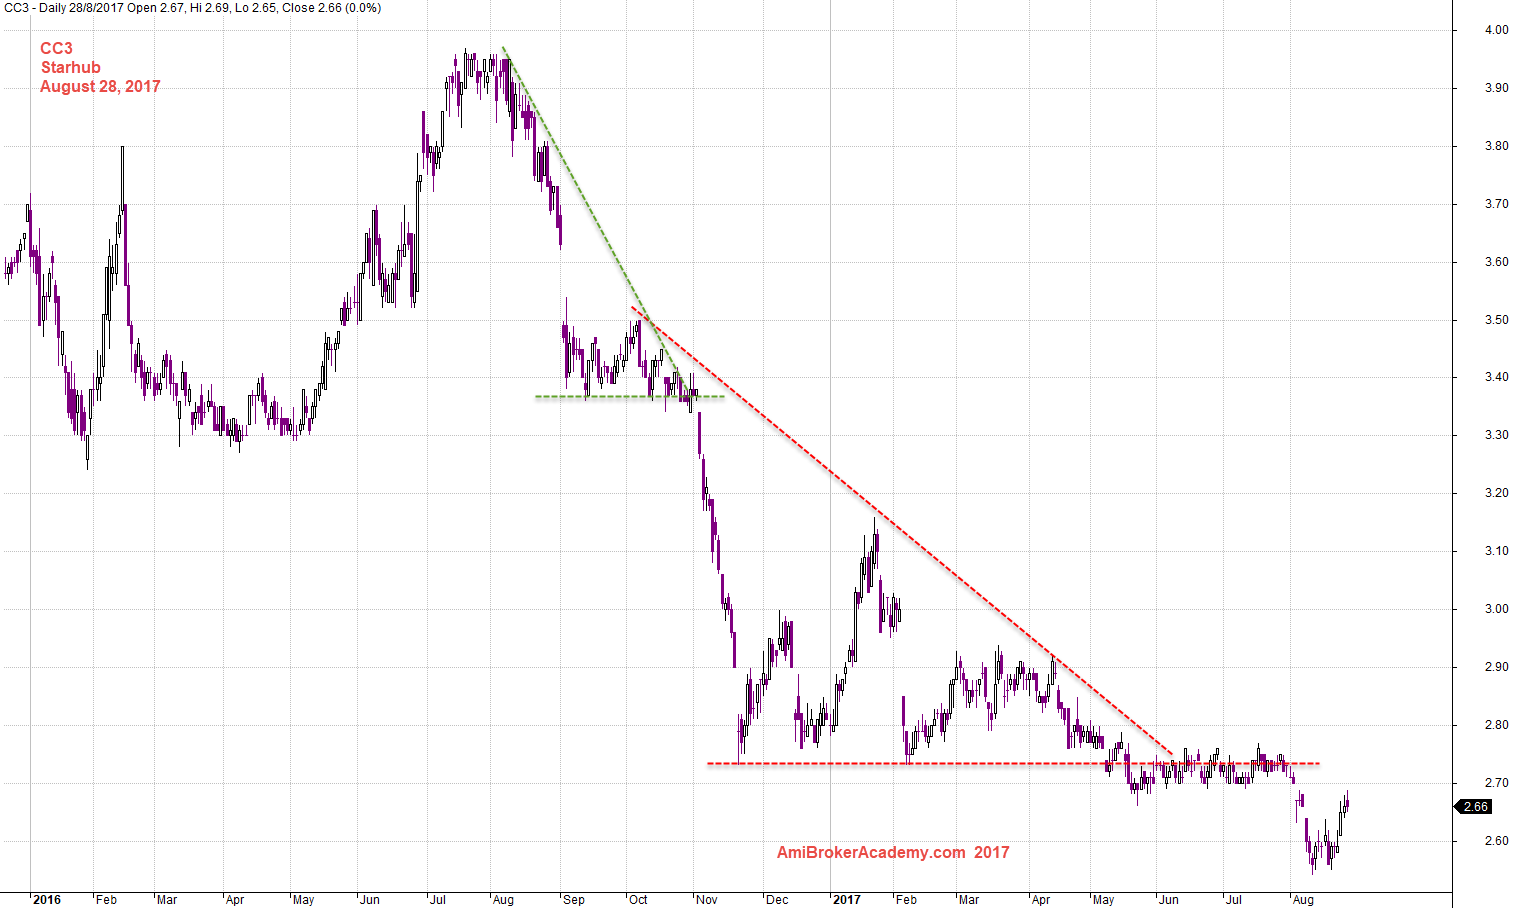
August 28, 2017 Starhub Daily and Bearish Trend
CC3 Starhub and Bearish Channel
Picture worth a thousand words. See chart for more.
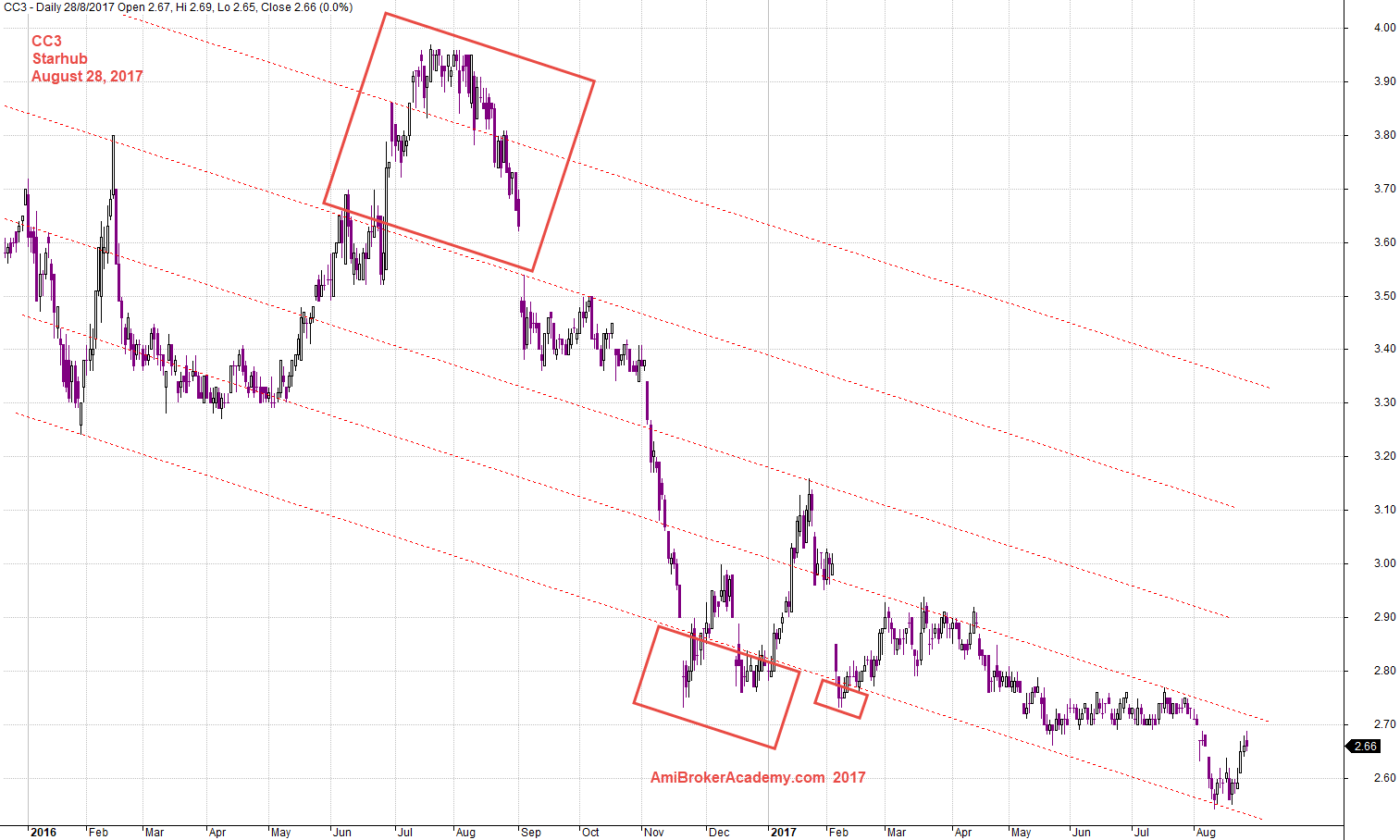
August 28, 2017 Starhub and Channel
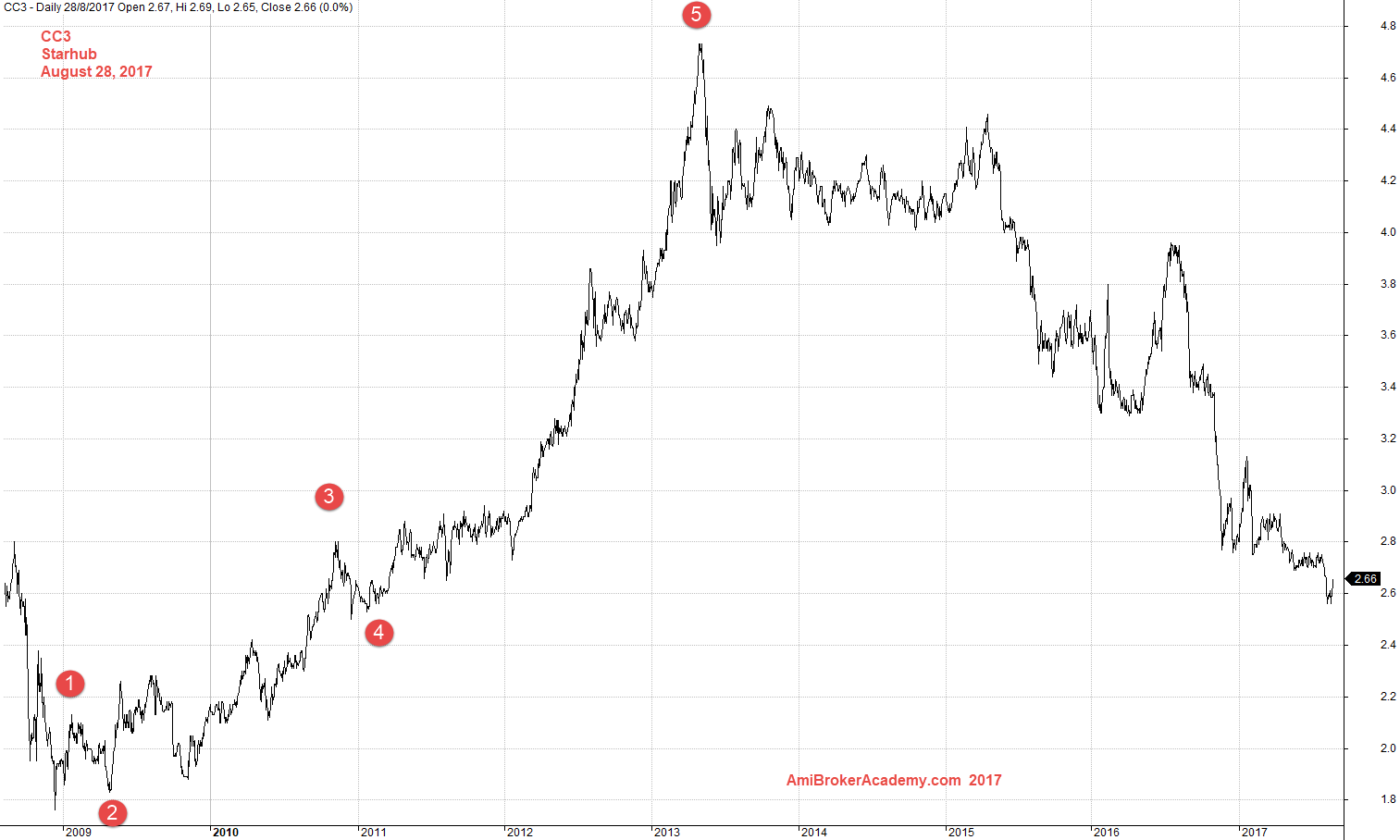
CC3 Starhub and Elliott Wave Count
Picture worth a thousand words. See chart for more.
If you can not find from chart like candlestick, change it to line chart. See the chart below, the data from 2009. We see the price pullback.
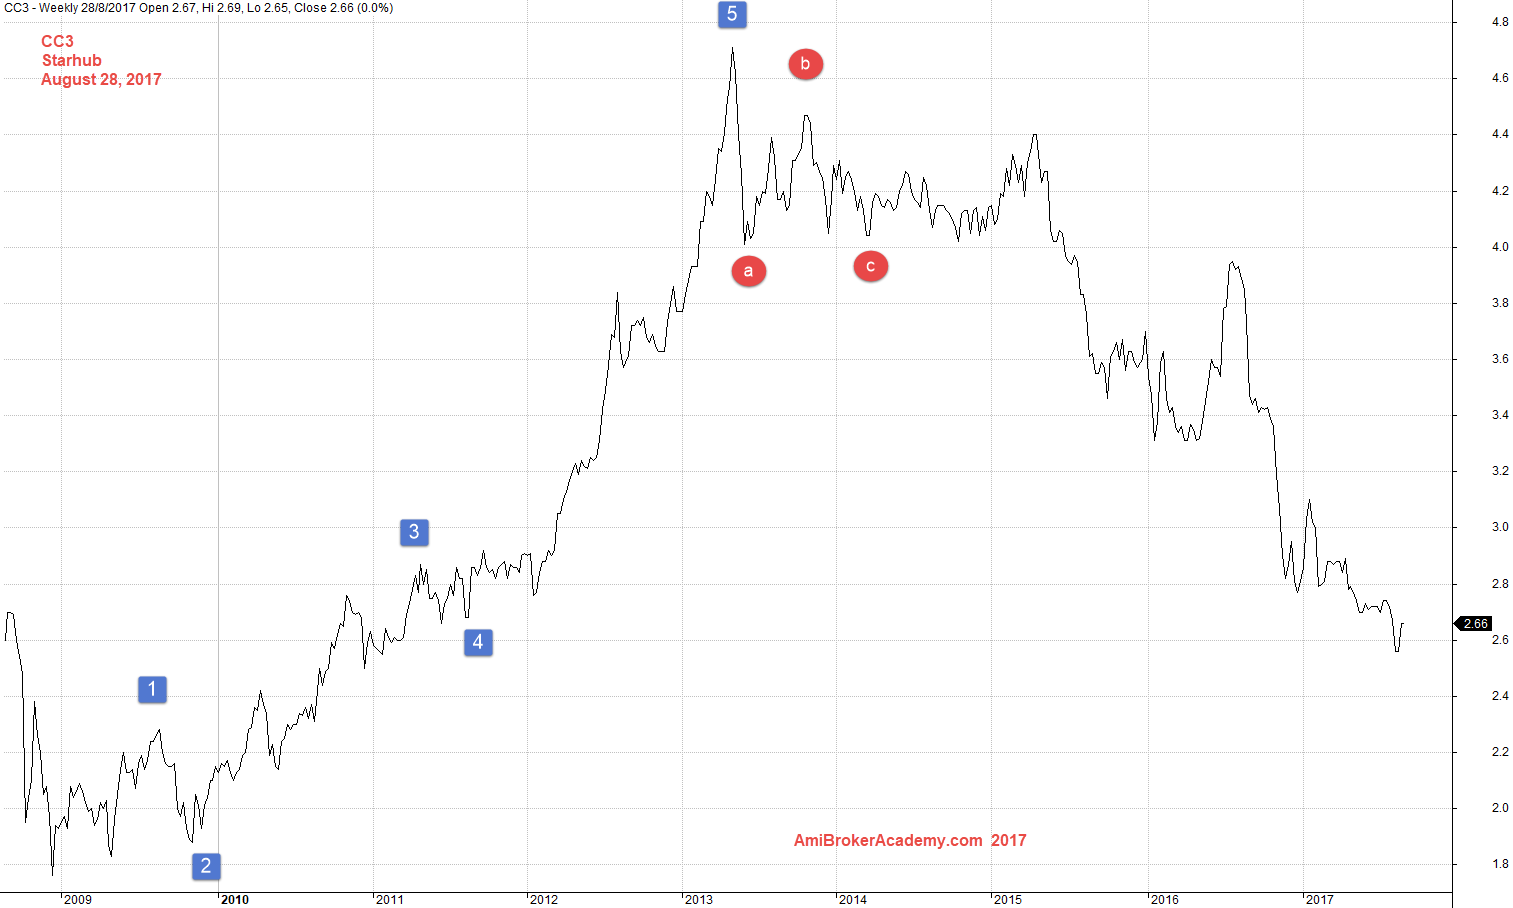
August 28, 2017 Starhub Line Chart and Elliott Wave
CC3 Starhub and Wave Count
Picture worth a thousand words. See chart for more.
August 28, 2017 Starhub and Wave Count
Thanks for visit the site here. You could also find free MACD scan here in this site too.
Moses
AmiBrokerAcademy.com
Disclaimer
The above result is for illustration purpose. It is not meant to be used for buy or sell decision. We do not recommend any particular stocks. If particular stocks of such are mentioned, they are meant as demonstration of Amibroker as a powerful charting software and MACD. Amibroker can program to scan the stocks for buy and sell signals.
These are script generated signals. Not all scan results are shown here. The MACD signal should use with price action. Users must understand what MACD and price action are all about before using them. If necessary you should attend a course to learn more on Technical Analysis (TA) and Moving Average Convergence Divergence, MACD.
Once again, the website does not guarantee any results or investment return based on the information and instruction you have read here. It should be used as learning aids only and if you decide to trade real money, all trading decision should be your own.