January 28, 2018
US Stock Analysis
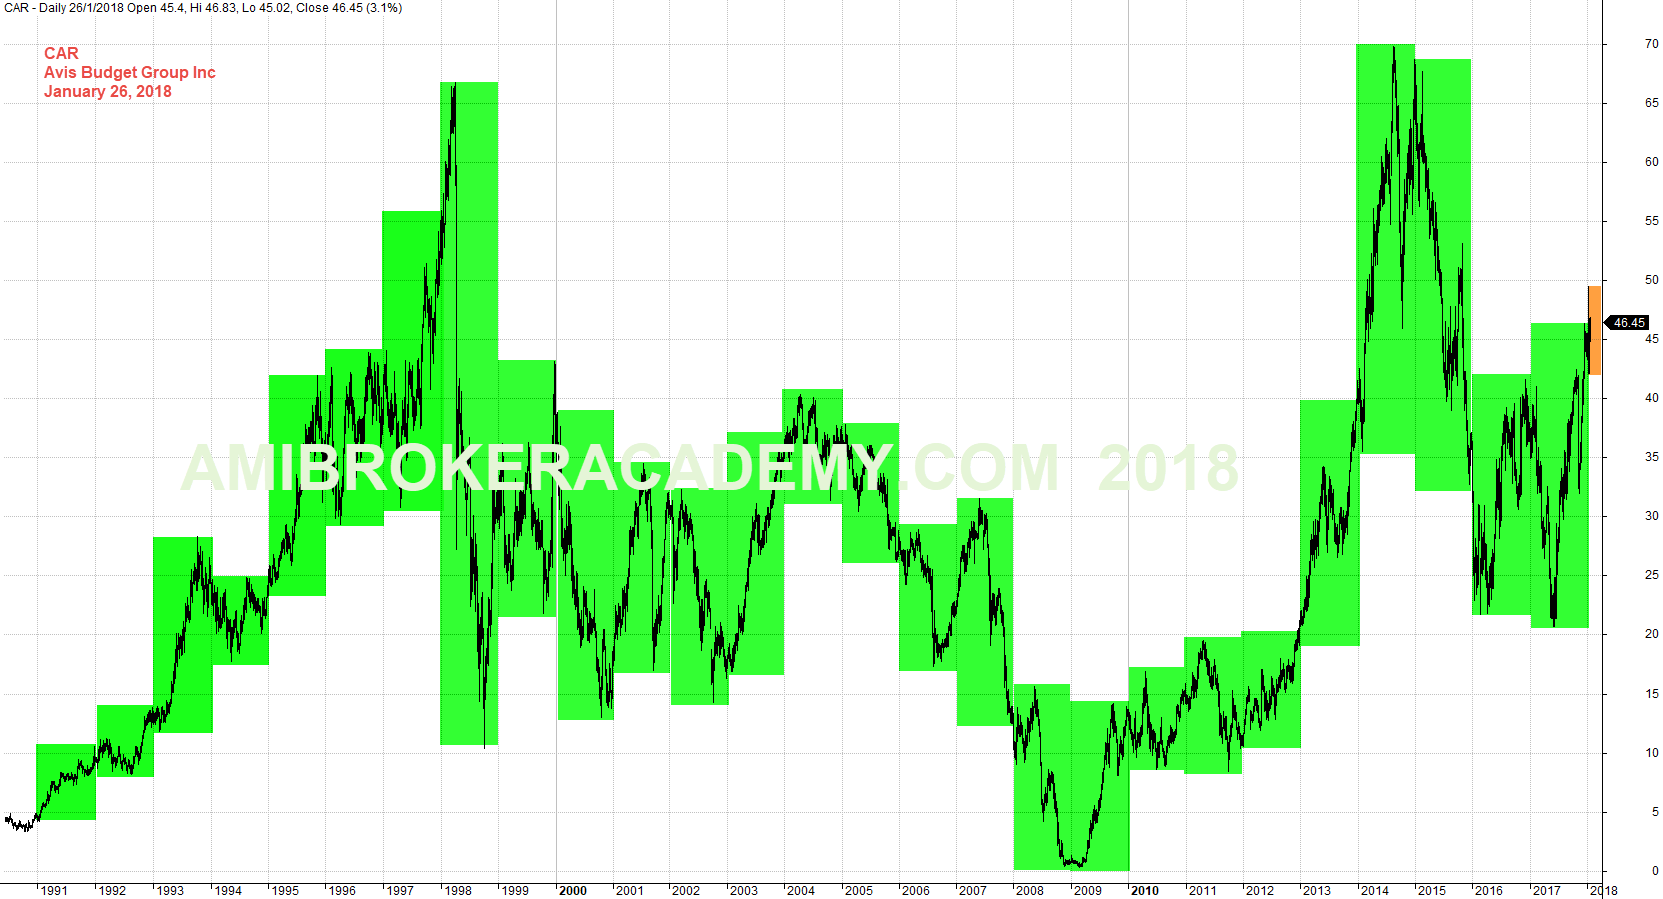
CAR Avis Budget Group Inc Year High Low From 1991
This company has been around for many years. If you have missed our recently posting about Avis hope you find (google) this one. Either we become inefficient on SEO, and key words. When we tested to search for the posting ourself, most of time we can’t find our latest posting bur history, may be back to 2014 and so on. Something is not right, either we are getting to back later in term of our key words, or the search engine got too intelligent, only favour the big guys now.
Big picture is always good such as looking at the data from back to 1990, as this will make you think. And think think got more things (a Cantonese phrase, cantonese is a language not dialect for Hong Kong). Do you realize that the high in 2014 had retest the high in 1998 before the recession? And you probably will also find after the speed up, it also speed down. This seems to be a universal truth. Both the peak, has the same shape; test the 70 then touch the 20 or lower.
Have fun learning!
Manage your risk!
Powerful Chart Software – AmiBroker
The following chart is produced using AmiBroker charting software. It is a powerful chart software. You plot the stocks you are interested all in one chart, as long as you still could read them. See chart below.
January 26, 2018 Avis Budget Group Year High Low
CAR Avis Budget Group Inc and MACD
Set up can always fail, this is true not just in financial trading itself. The same rule has also apply to physical world, business, trading (import export business), education, and technologist. So are you going to believe that solar energy is going to be more earth friendly to fuss like petrol and natural gas. Will see. Anyone has begin to study the recycle of the waste created by the solar technologies, the panel, the side effect from the ray reflection and so on. Sorry, I am not scientist, these are just a few words, or things I know. And again, think think got more things.
We like to study the big big picture of a stock. And we like to use such as MACD to study the last six to ten months price action and the MACD signals.
Picture worth a thousand words, see trend or trading entry. Have fun!
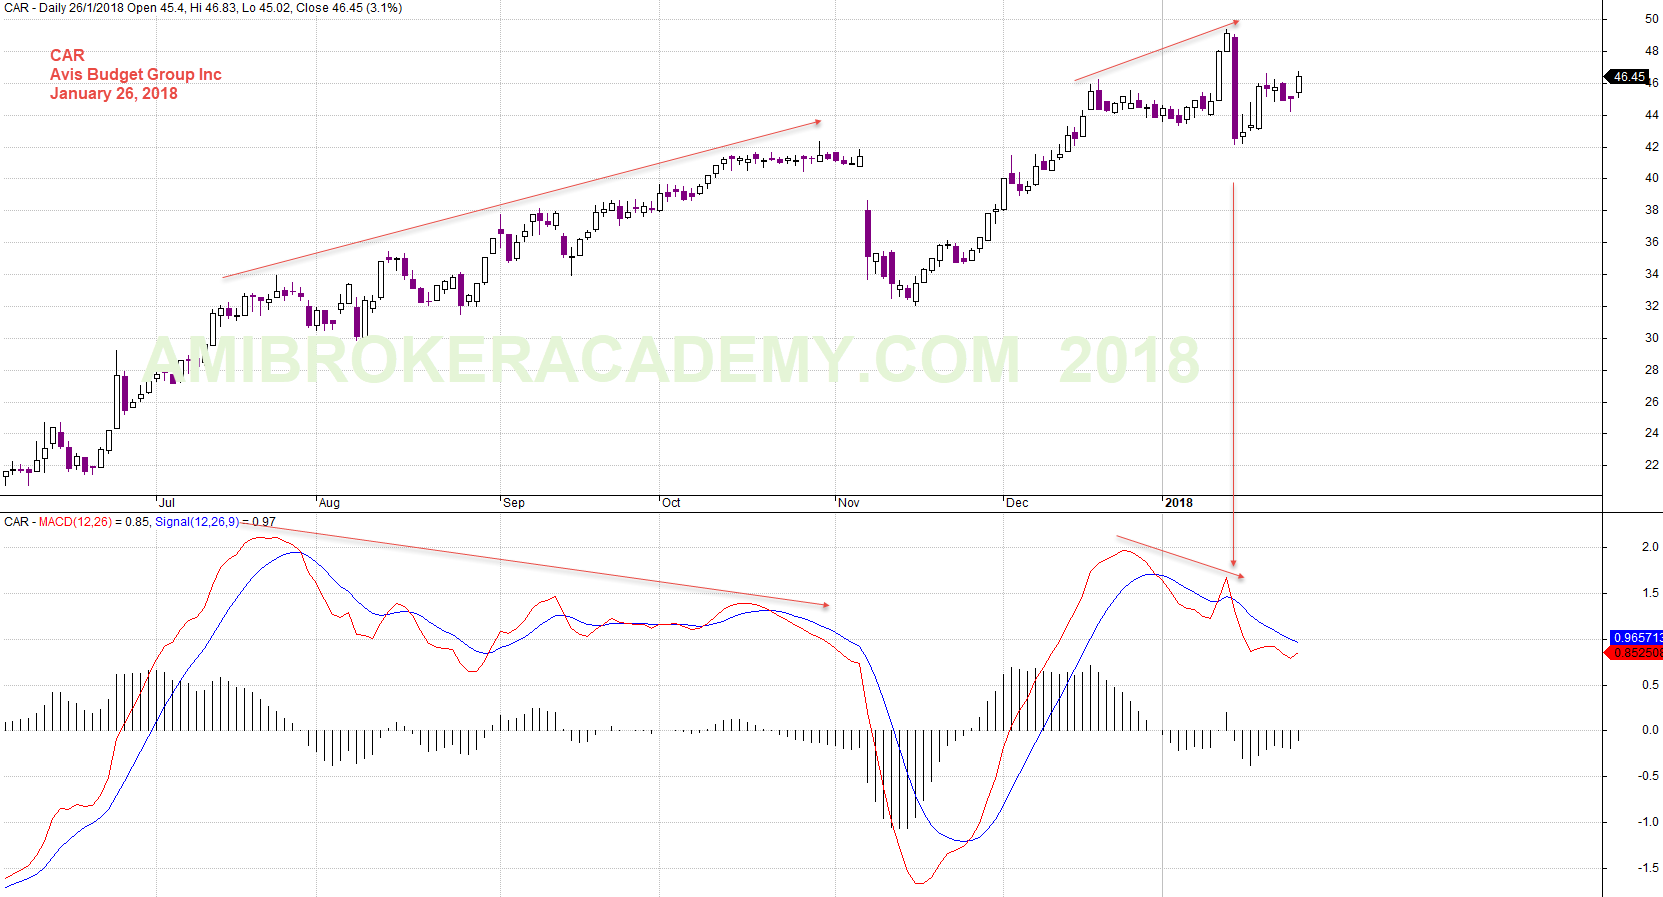
January 26, 2018 Avis Budget Group and MACD
Moses
AmiBrokerAcademy.com
Disclaimer
The above result is for illustration purpose. It is not meant to be used for buy or sell decision. We do not recommend any particular stocks. If particular stocks of such are mentioned, they are meant as demonstration of Amibroker as a powerful charting software and MACD. Amibroker can program to scan the stocks for buy and sell signals.
These are script generated signals. Not all scan results are shown here. The MACD signal should use with price action. Users must understand what MACD and price action are all about before using them. If necessary you should attend a course to learn more on Technical Analysis (TA) and Moving Average Convergence Divergence, MACD.
Once again, the website does not guarantee any results or investment return based on the information and instruction you have read here. It should be used as learning aids only and if you decide to trade real money, all trading decision should be your own.