May 15, 2017
Can the history repeat itself?
For pattern recognition, you always look back to find possible pattern that may be repeat itself.
Can DJI NASDAQ Fail in 2017?
Both DJI and NASDAQ are high, very high now. What to continue to push before a pullback. Will the pullback a big one. Who know? As said for pattern recognition, you always look back. Check out the chart on before 2000.
Bench Marking Japan Nikkei 225, US Dow Jones Industrial Average and NASDAQ Composite Index
Picture worth a thousand words. The following is a stock markets history at a glance, between 1996 to 2004.
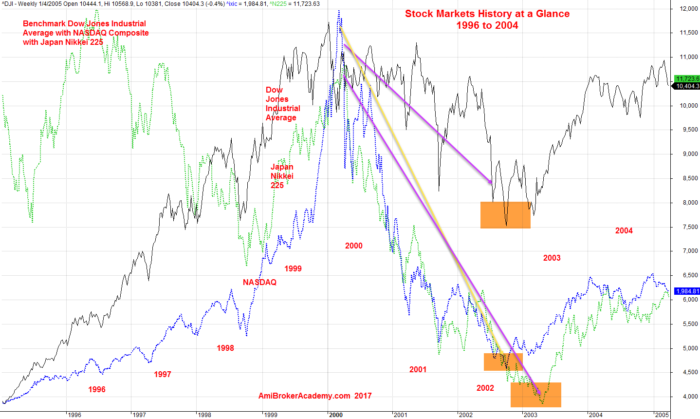
May 15, 2017 Stock Markets 1996 to 2004
The analysis here is intended to be a tutorial only. We look at the chart from different views. We mainly study the popular stocks in US market and Singapore. Hope you can learn something. There is no right no wrong.
Moses Stock Analysis
AmiBrokerAcademy.com
Disclaimer
The above result is for illustration purpose. It is not meant to be used for buy or sell decision. We do not recommend any particular stocks. If particular stocks of such are mentioned, they are meant as demonstration of Amibroker as a powerful charting software and MACD. Amibroker can program to scan the stocks for buy and sell signals.
These are script generated signals. Not all scan results are shown here. The MACD signal should use with price action. Users must understand what MACD and price action are all about before using them. If necessary you should attend a course to learn more on Technical Analysis (TA) and Moving Average Convergence Divergence, MACD.
Once again, the website does not guarantee any results or investment return based on the information and instruction you have read here. It should be used as learning aids only and if you decide to trade real money, all trading decision should be your own.