November 26, 2017
Singapore Stock Analysis
C31 Capitaland Stock Strength
See chart below, this is not line chart. This is MACD Indicator. From the indicator, you can see the price strength is getting weaker and weaker. So, if the MACD trend continue to go lower, the price will sooner or later to travel south.
This is another way to see the future price direction. And all setup can fail.
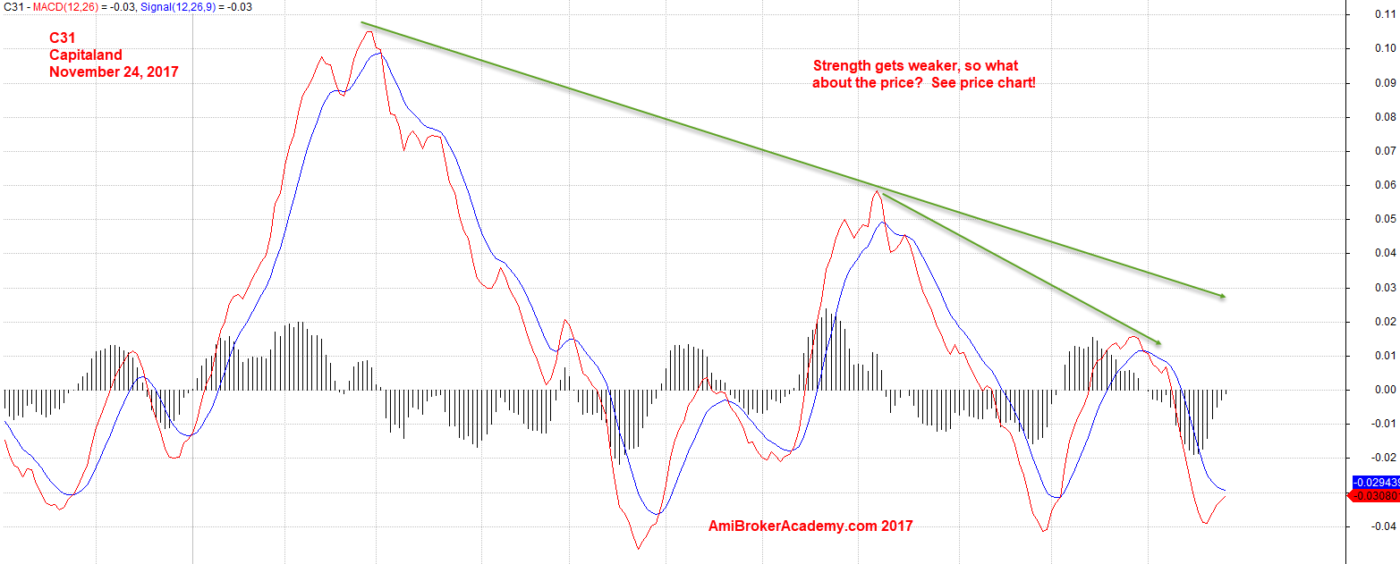
November 24, 2017 Capitaland Stock Strength
Moses
AmiBrokerAcademy.com
Disclaimer
The above result is for illustration purpose. It is not meant to be used for buy or sell decision. We do not recommend any particular stocks. If particular stocks of such are mentioned, they are meant as demonstration of Amibroker as a powerful charting software and MACD. Amibroker can program to scan the stocks for buy and sell signals.
These are script generated signals. Not all scan results are shown here. The MACD signal should use with price action. Users must understand what MACD and price action are all about before using them. If necessary you should attend a course to learn more on Technical Analysis (TA) and Moving Average Convergence Divergence, MACD.
Once again, the website does not guarantee any results or investment return based on the information and instruction you have read here. It should be used as learning aids only and if you decide to trade real money, all trading decision should be your own.