August 20, 2017
Is the glass half-full or half-empty?
Half Empty (Source: Photo taken from Internet)
Whether the glass if half-full or half-empty, are you an optimist or a pessimist?
In trading, you meet with such decision all the time? Bullish? Bearish? Buy? Sell?
When you study a chart, you see two sides of the possibility on the trend. Bullish or Bearish.
Inner game of a trader.
Buy or Sell or Hold!
Remember ‘No Right No Wrong’ in trading or may be should say in life. No one can predict what will happen next.
But for sure what goes up must come down.
In our earlier posting, we share with you the three local banks, UOB, OCBC and DBS their chart. In fact, there are very little different from the share, of in trading we say pattern, chart pattern. If you will compare them with ST Index, in fact they look similar too. Wow!
In the following postings, we are going to look at the banks separately. So, watch the space here, if you are interested to find out a bit more of these three local bank. See you.
O39 Oversea-Chinese Banking Corp Charting
Picture worth a thousand words. Share price downflow, and bounce up 2016.
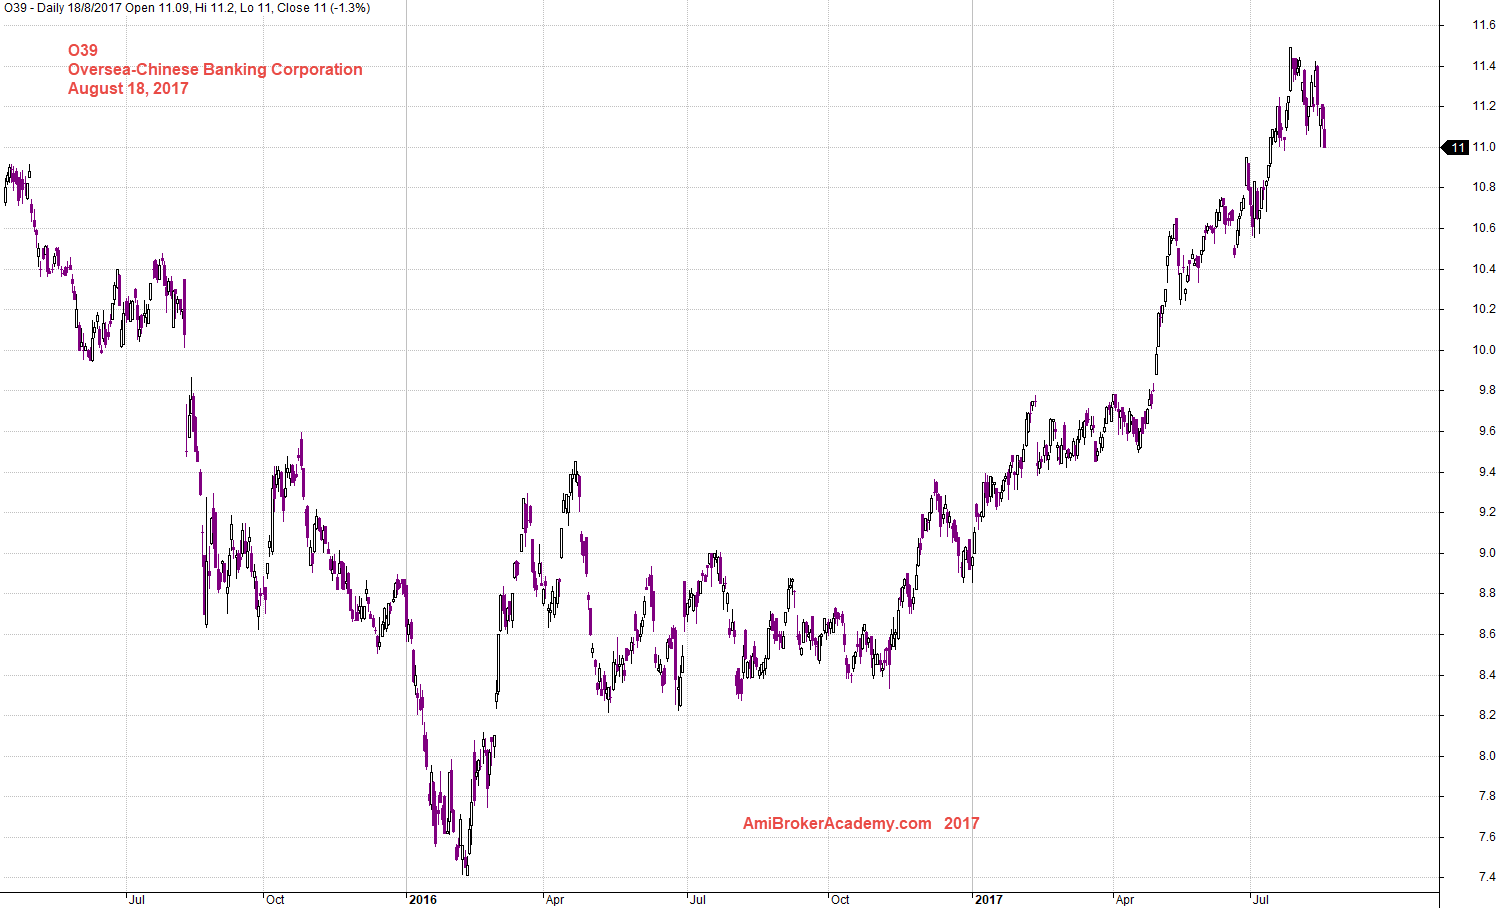
August 18, 2017 Oversea-Chinese Banking Corp Charting
O39 Oversea-Chinese Banking Corporation and Key Levels
Picture worth a thousand words. In the following chart, the share price is retesting the high 2015. Share price has a down flow, and rebounce up after 2016. The share price breakout higher than the 2015 high in the chart and now pullback to retest that high.
So, we see a big U, or a head-and-shoulders.
Is this a good time to buy again? Well, if the $11 can hold the fall. May be can buy at $11, when the level get retest again.
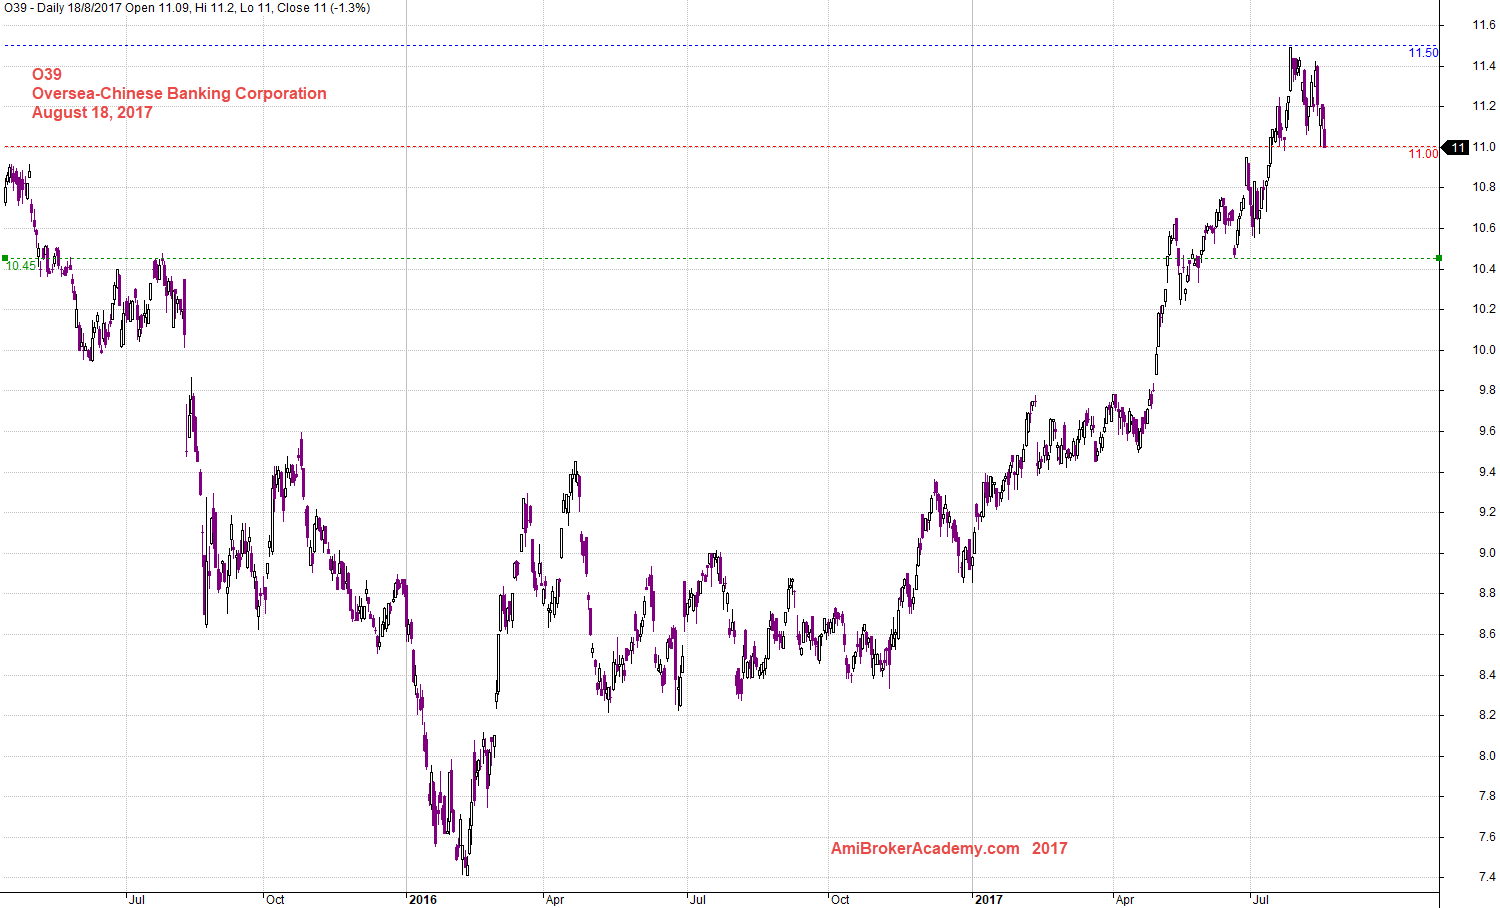
August 18, 2017 Oversea-Chinese Banking Corp and Key Levels
O39 Oversea-Chinese Banking Corp and Channel
Picture worth a thousand words.
From the chart you see the price travel from layer to layer. Of course, the price is trapped within the big channel. But if you break the channel down into smaller layer. You could see the price move from one layer to another.
What can you get out of these layers?
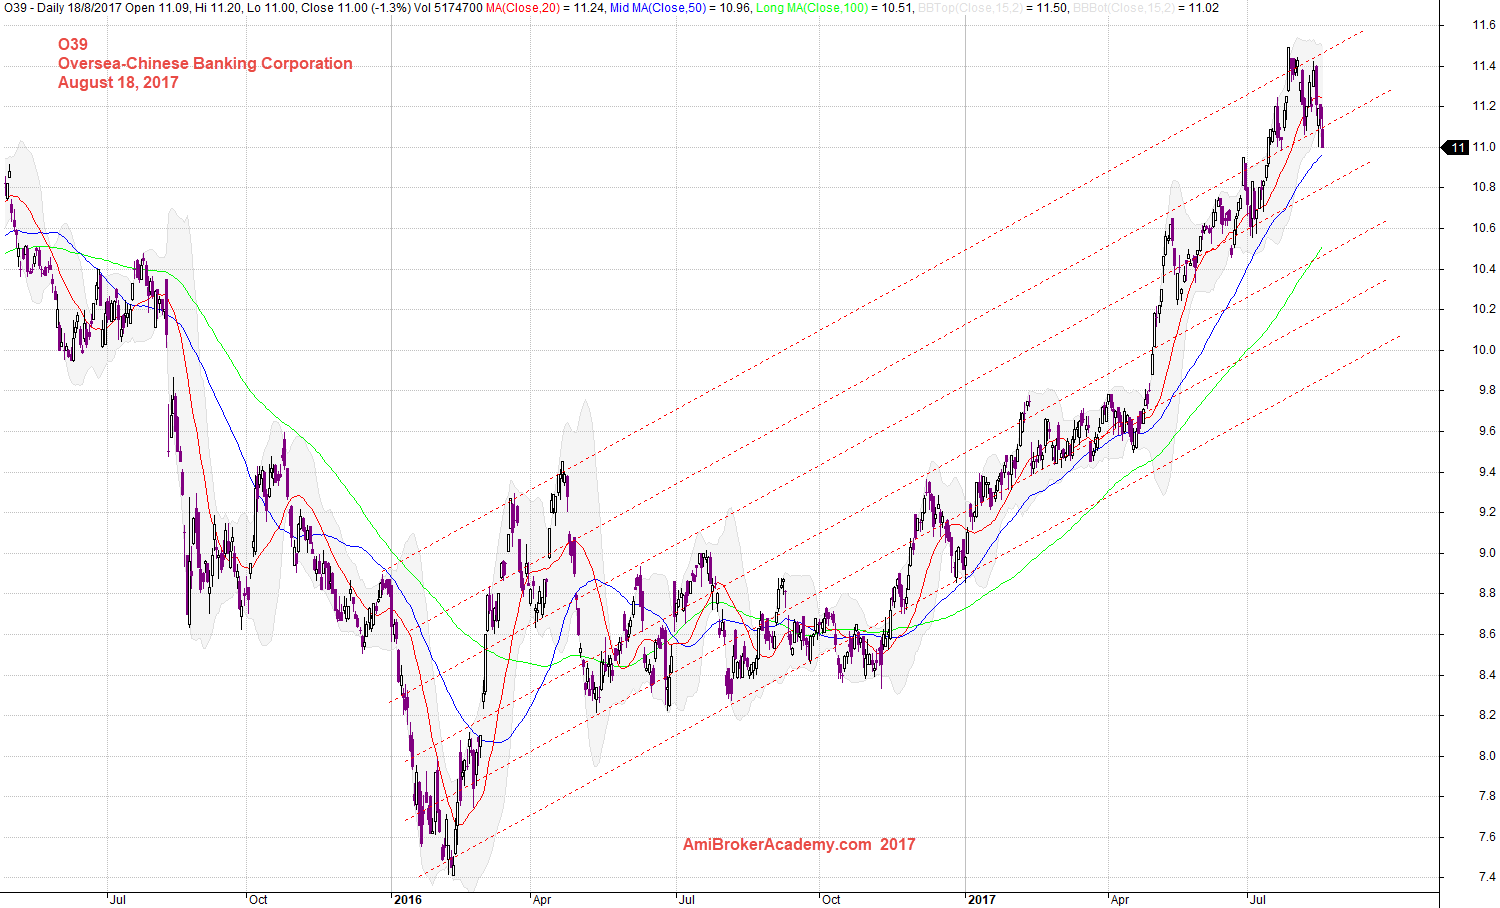
August 18, 2017 Oversea-Chinese Banking Corp and Channel
Thanks for visit the site here. You could also find free MACD scan here in this site too.
Moses
AmiBrokerAcademy.com
Disclaimer
The above result is for illustration purpose. It is not meant to be used for buy or sell decision. We do not recommend any particular stocks. If particular stocks of such are mentioned, they are meant as demonstration of Amibroker as a powerful charting software and MACD. Amibroker can program to scan the stocks for buy and sell signals.
These are script generated signals. Not all scan results are shown here. The MACD signal should use with price action. Users must understand what MACD and price action are all about before using them. If necessary you should attend a course to learn more on Technical Analysis (TA) and Moving Average Convergence Divergence, MACD.
Once again, the website does not guarantee any results or investment return based on the information and instruction you have read here. It should be used as learning aids only and if you decide to trade real money, all trading decision should be your own.