August 18, 2017
We have discussed about France and Britain leading the way to ban petrol and diesel cars in the future.
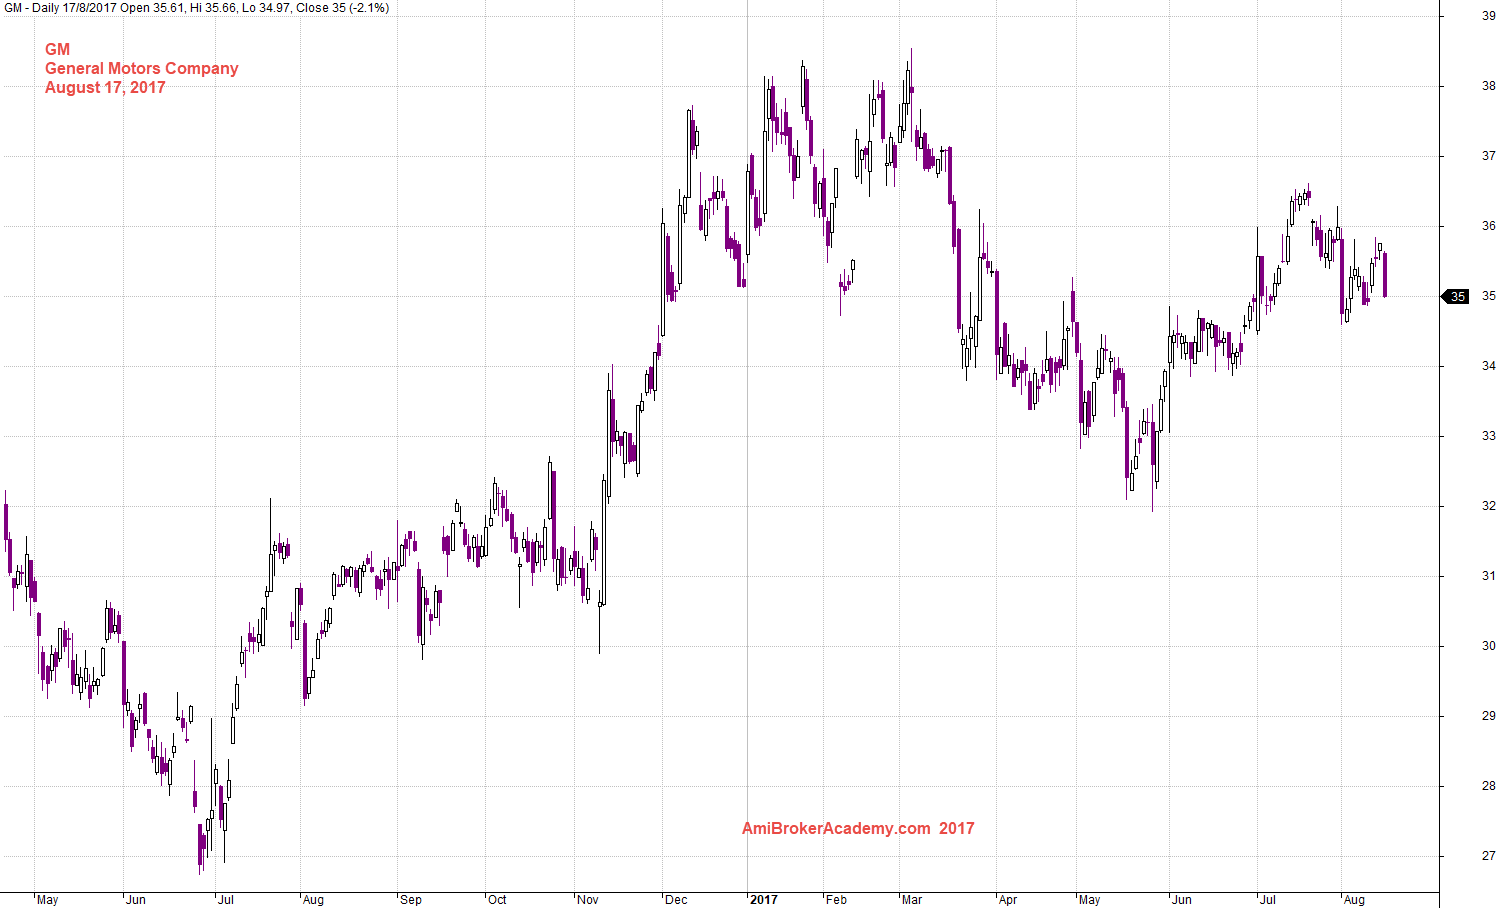
GM General Motors has broken out in the last two months, F Ford Motor remains stuck under steep down trend.
GM General Motors Company and Support Resistance
See chart for more, picture worth a thousand words.
Share price retest $35, this is a very important level. The share price breakout the two months high.
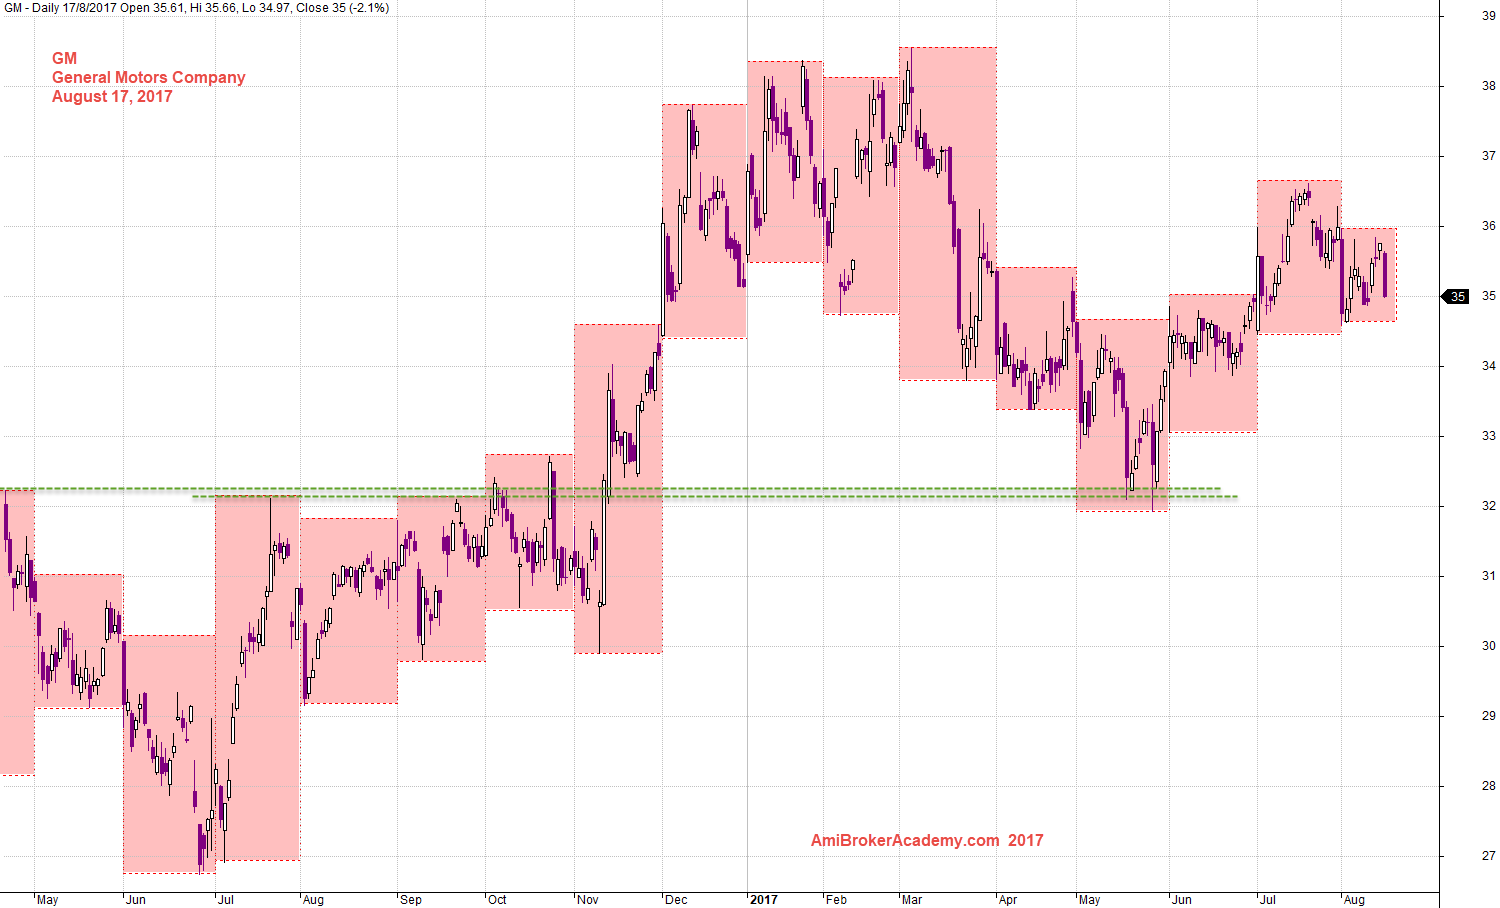
August 17, 2017 General Motors Company and Support Resistance
GM General Motors Company and 34 MA Band
Picture worth a thousand words, the chart shows the price action finally caught in the optimal zone, within the MA band. Price action either re bounce above 34 MA band or below 34 MA band. Will See.
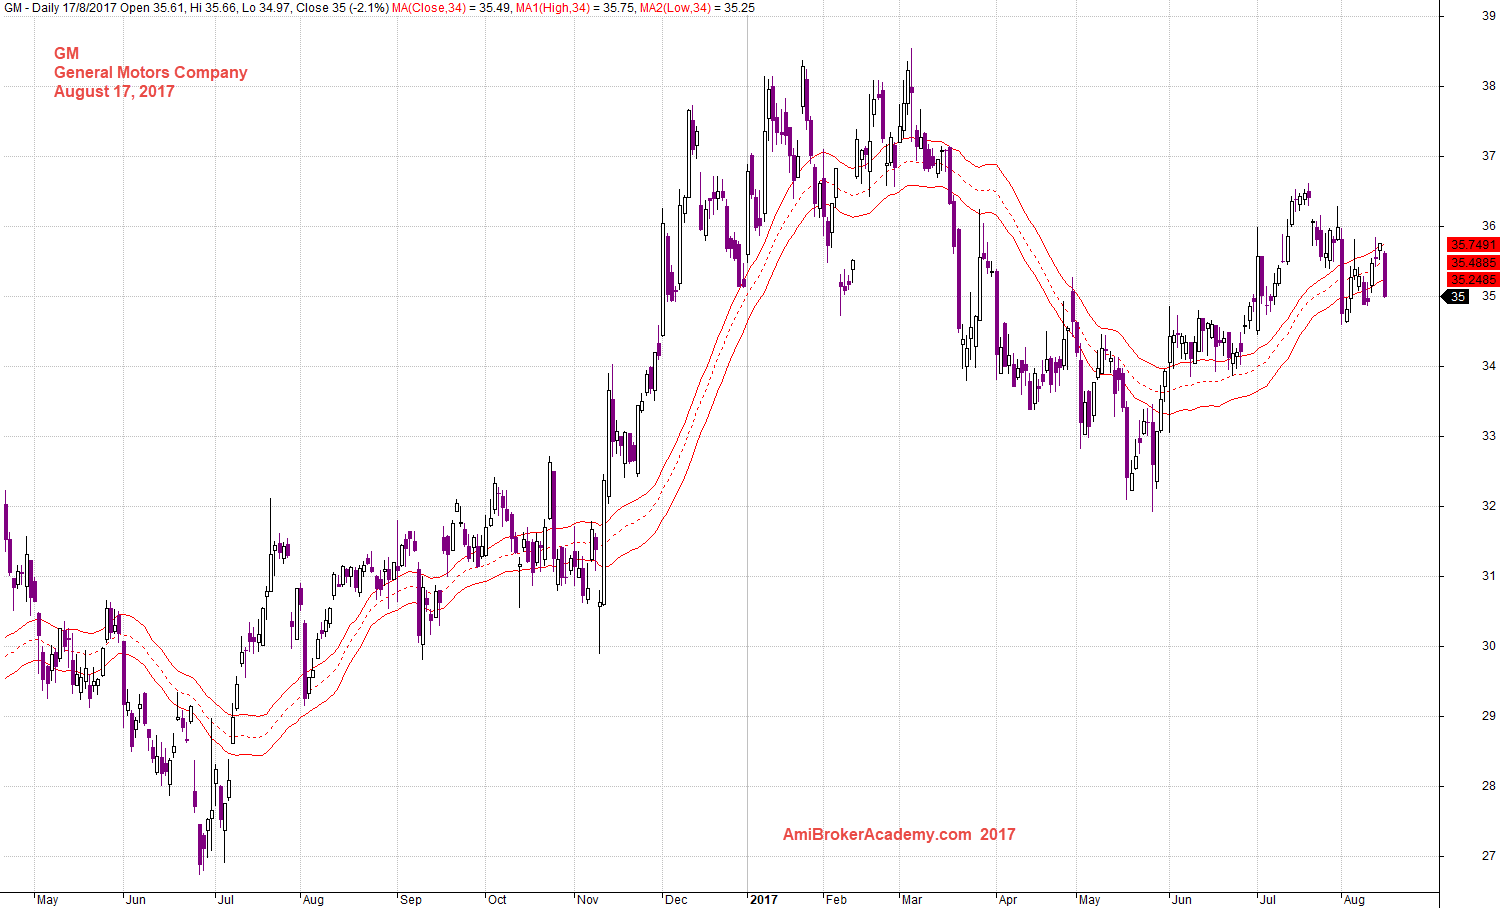
August 17, 2017 General Motors Company and 34 MA Band
General Motors and MACD Signals
Picture worth a thousand words, the chart share prices moving sideways.
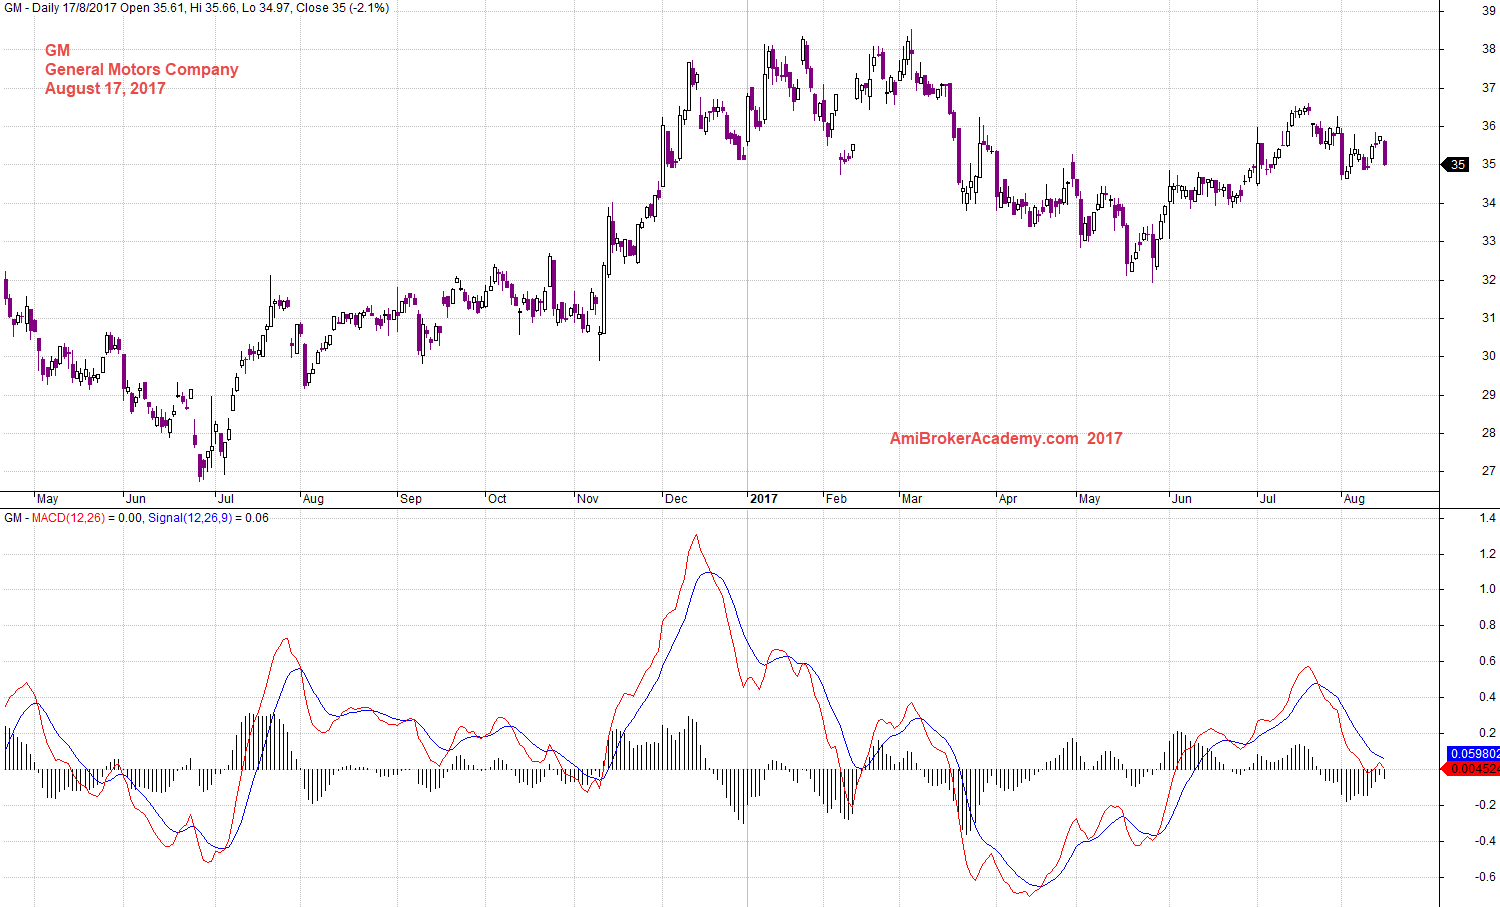
August 17, 2017 General Motors and MACD
GM General Motors and Line Chart
Picture worth a thousand words, if you can not see the trend better in other charting, such as candlestick. You can try line chart.
Wave Count
Elliot Wave Count, so the trend retrace back.
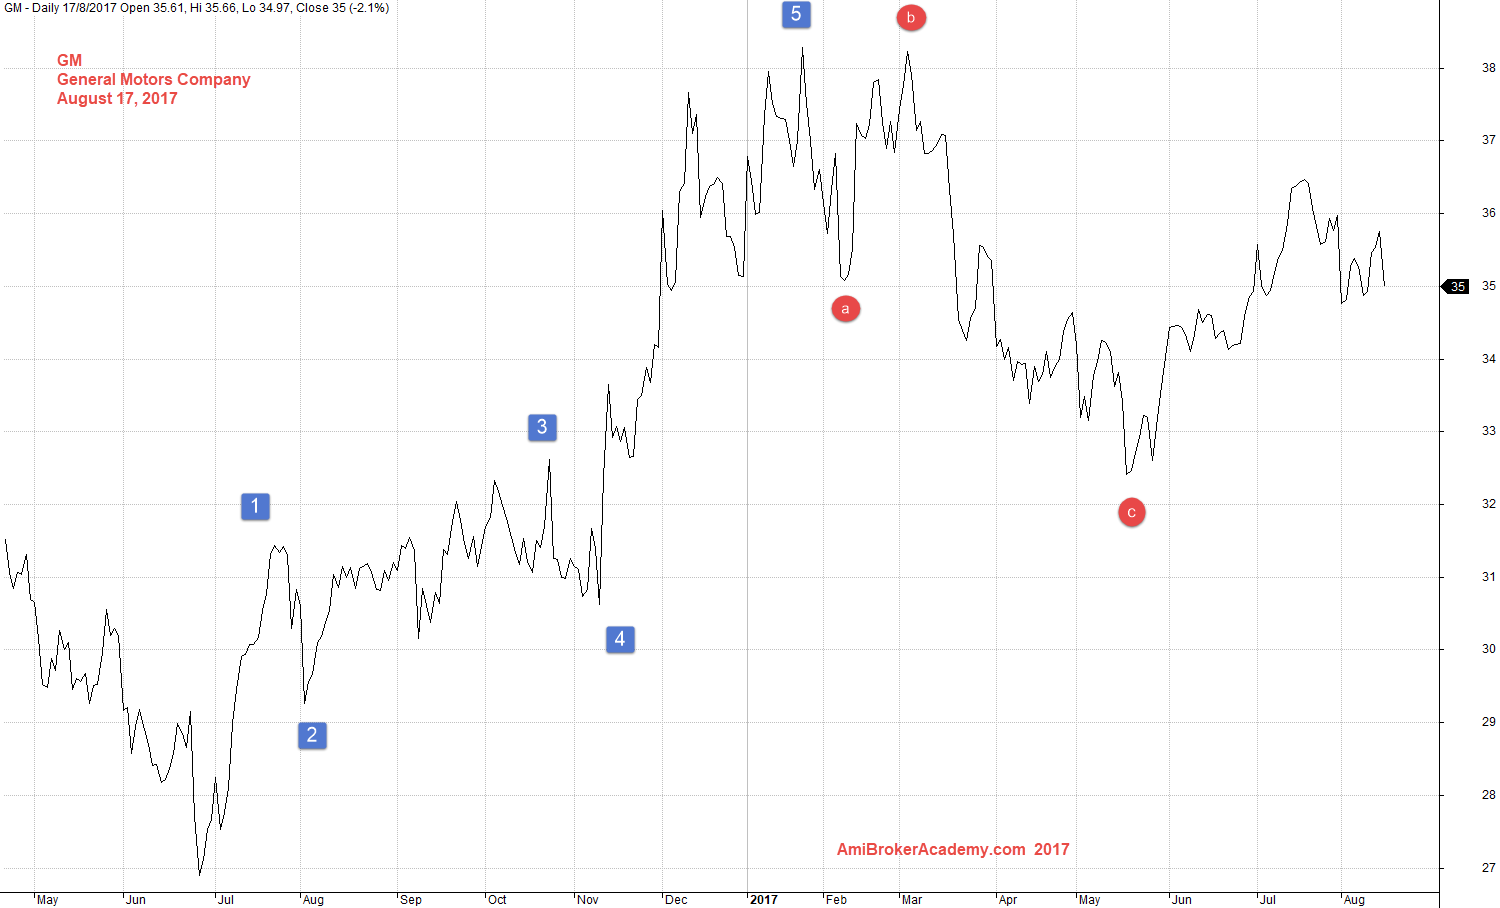
August 17, 2017 General Motors Company and Wave Count
GM General Motors and Candlestick Chart
Picture worth a thousand words. if you can see the wave count easily from the following chart, you can try the line chart. See above.
August 17, 2017 General Motors and Candlestick Chart
Thanks for visit the site here. You could also find free MACD scan here in this site too.
Moses
AmiBrokerAcademy.com
Disclaimer
The above result is for illustration purpose. It is not meant to be used for buy or sell decision. We do not recommend any particular stocks. If particular stocks of such are mentioned, they are meant as demonstration of Amibroker as a powerful charting software and MACD. Amibroker can program to scan the stocks for buy and sell signals.
These are script generated signals. Not all scan results are shown here. The MACD signal should use with price action. Users must understand what MACD and price action are all about before using them. If necessary you should attend a course to learn more on Technical Analysis (TA) and Moving Average Convergence Divergence, MACD.
Once again, the website does not guarantee any results or investment return based on the information and instruction you have read here. It should be used as learning aids only and if you decide to trade real money, all trading decision should be your own.