July 18, 2017
In our last post, we analyse ST Index with MACD indicator. The following post, we see chart in different ways. Enjoy learning.
Straits Times Index
STI moves in zigzag. STI close higher today, higher than the last high. See chart for more.
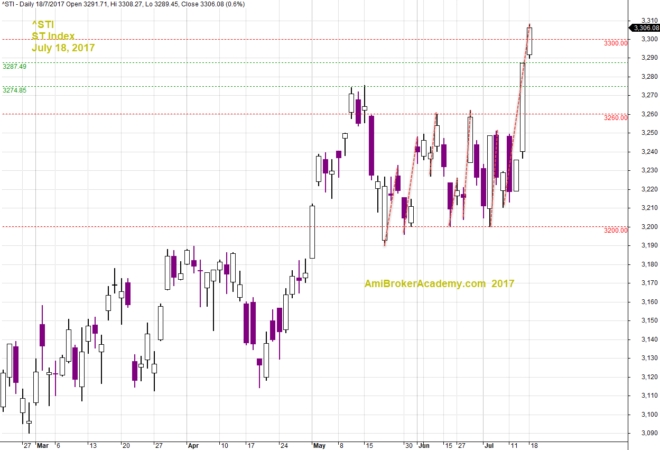
July 18, 2017 ST Index and Zigzag Momentum
Straits Times Index and Support Resistance
STI breakout from resistance get resisted again. STI pullback to test the resistance turns support. ST Index bounce up and break the 3200 level, and finally STI break 3300 level.
PA has to pullback again before can swing higher. See the moment next week.
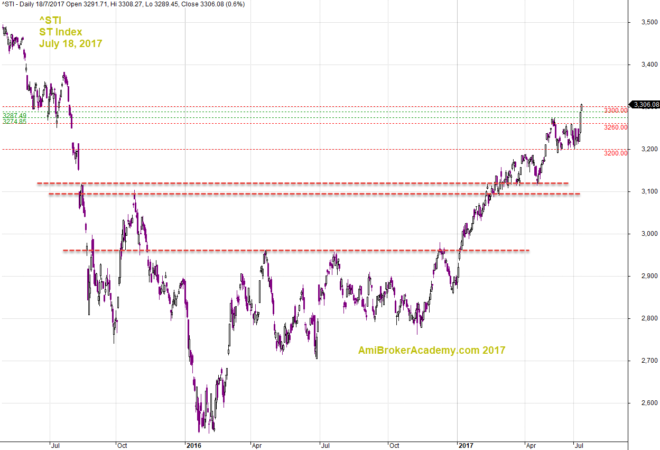
July 18, 2017 Straits Times Index and Key Levels and Support Resistance
Straits Times Index and ABCD Pattern
Picture worth a thousand words, see ABCD Chart Pattern.
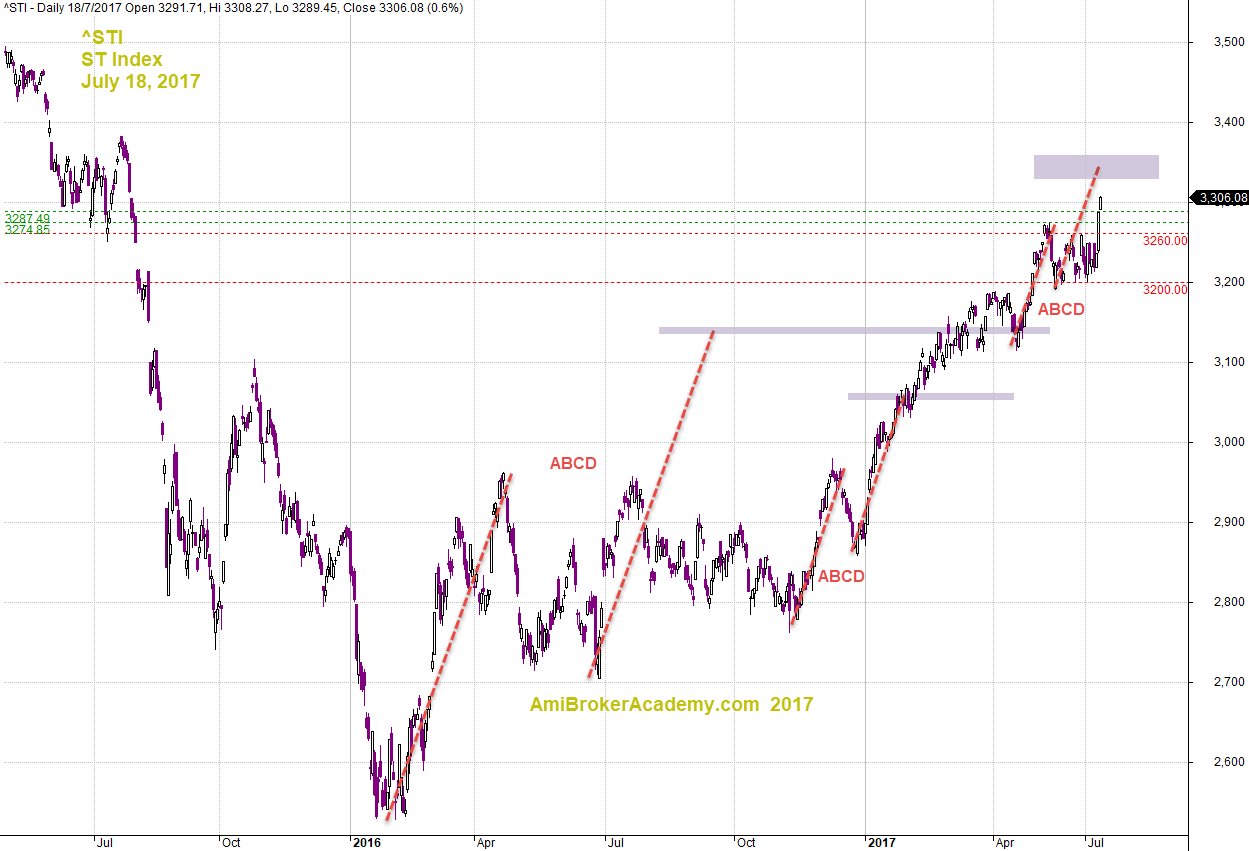
July 18, 2017 ST Index and ABCD Pattern
Straits Times Index and Moving Averages
ST Index supported by MAs and rally again. See chart for details.
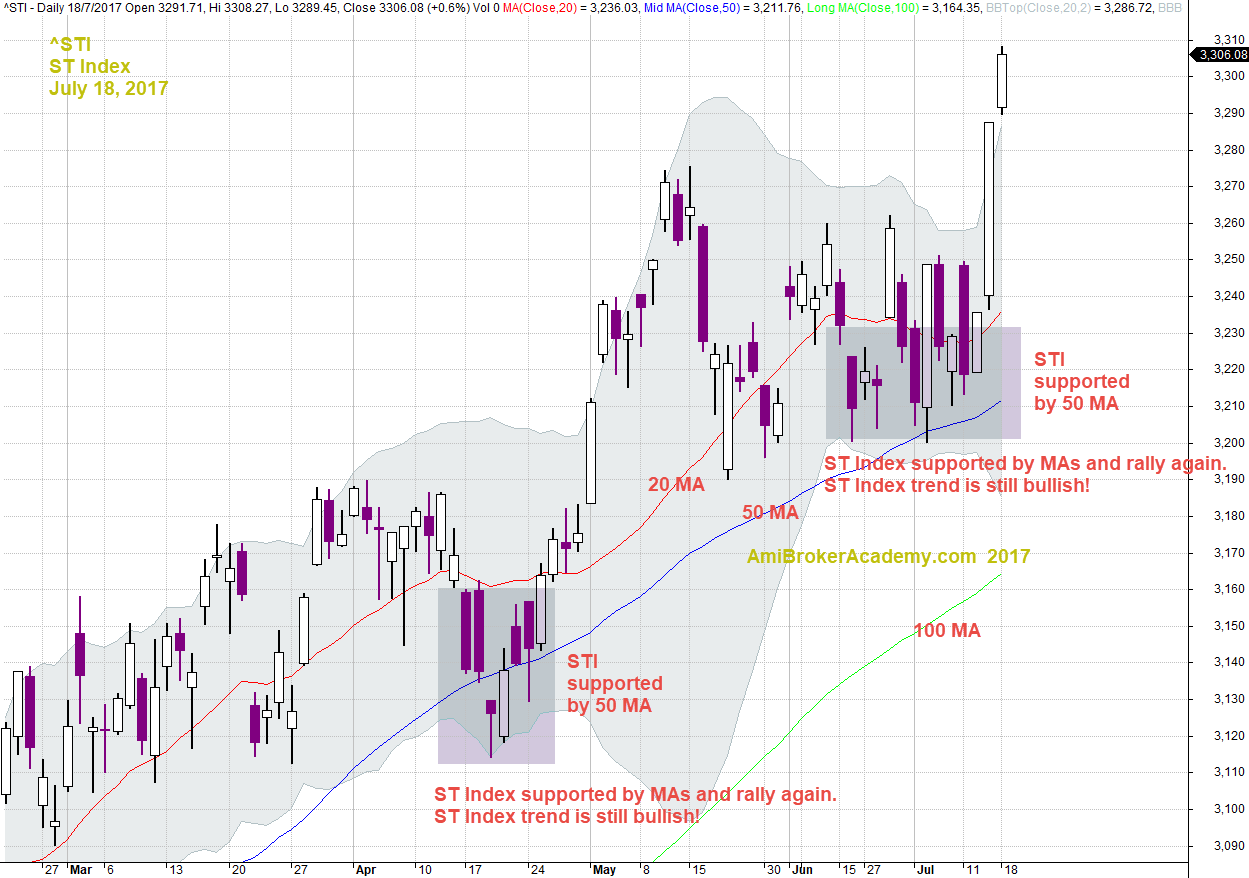
July 18, 2017 ST Index and Moving Averages
Straits Times Index and Channels
Connect any two low and draw a trendline. Copy and paste the trendline to any peak. The two parallel trendlines form a equal distance channel. EDC is also a great visual tool for inspecting the chart. When channel slop from bottom left to top right, the trend direction is uptrend, or bullish bias trend.
Now ST Index has resisted by the upper trendline, or upper channel. So, watch the resistance.
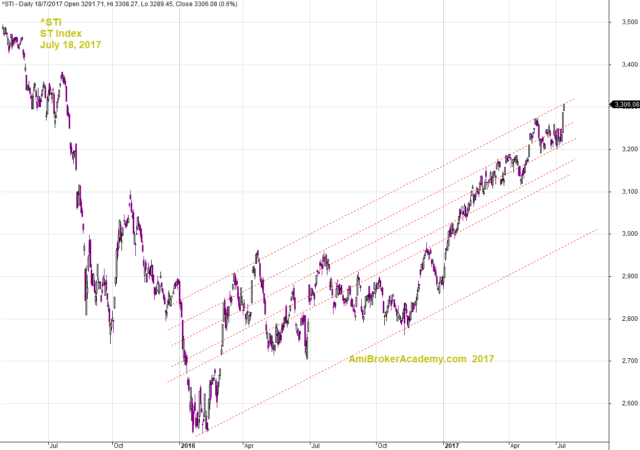
July 18, 2017 ST Index and Channels
Moses
AmiBrokerAcademy.com
Disclaimer
The above result is for illustration purpose. It is not meant to be used for buy or sell decision. We do not recommend any particular stocks. If particular stocks of such are mentioned, they are meant as demonstration of Amibroker as a powerful charting software and MACD. Amibroker can program to scan the stocks for buy and sell signals.
These are script generated signals. Not all scan results are shown here. The MACD signal should use with price action. Users must understand what MACD and price action are all about before using them. If necessary you should attend a course to learn more on Technical Analysis (TA) and Moving Average Convergence Divergence, MACD.
Once again, the website does not guarantee any results or investment return based on the information and instruction you have read here. It should be used as learning aids only and if you decide to trade real money, all trading decision should be your own.