August 26, 2017
ST Index and Bar by Bar
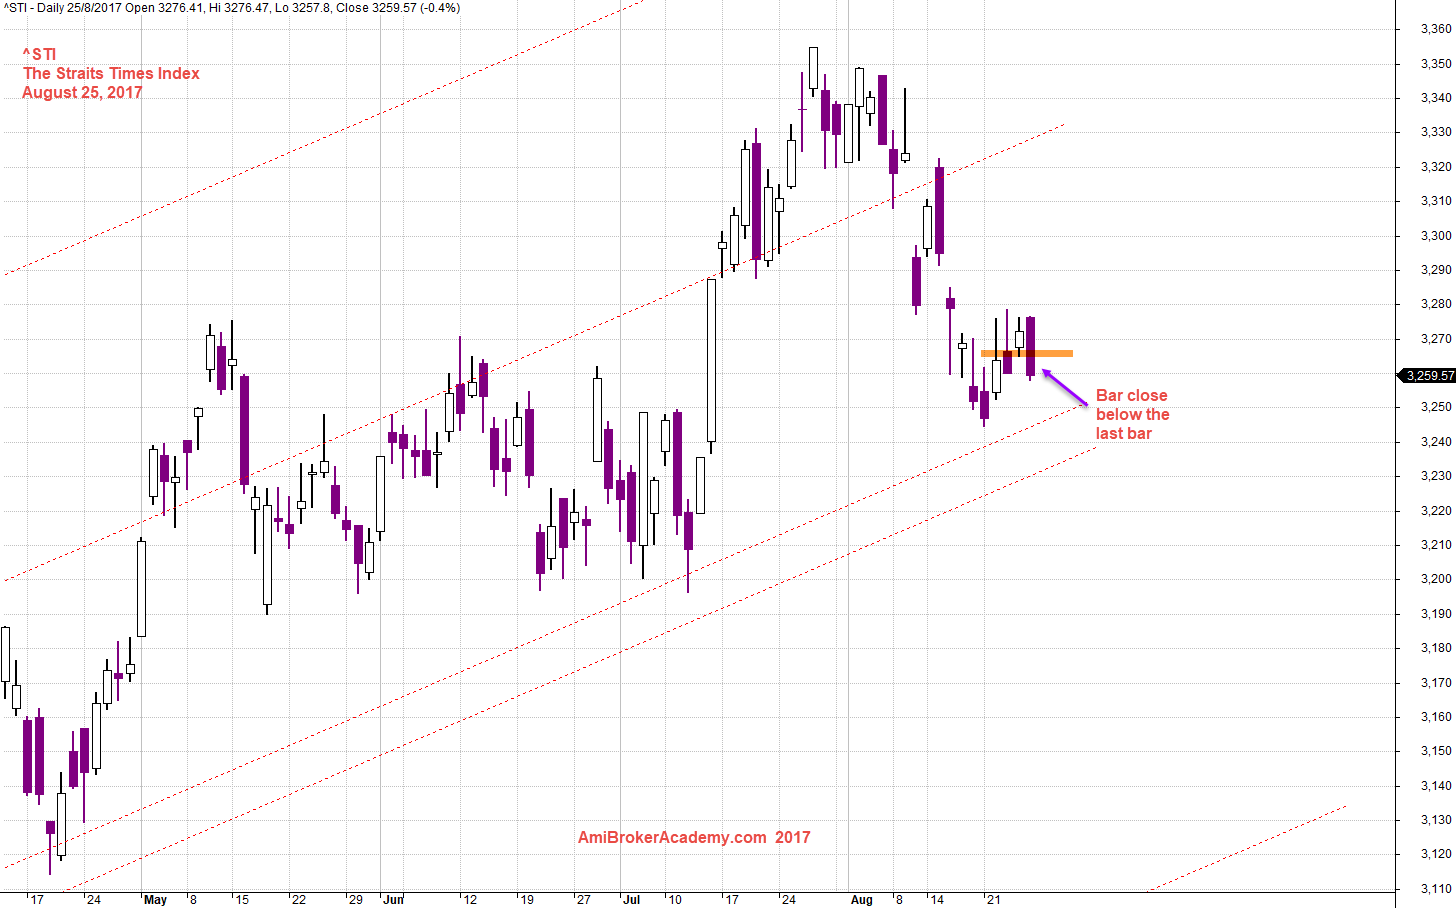
Have a close up view, we see a bullish trend after the index supported by the low trendline, a long tail bullish bar close above the bear bar. The bear trry to close lower, but can not even cross half of the bull bar body. The next day a bull bar close above the bear bar.
Friday, August 25 the big bear, a near full body bear closes below the bull bar. See chart.
Will the bear set in? Will see.
August 25, 2017 ST Index and Bar by Bar
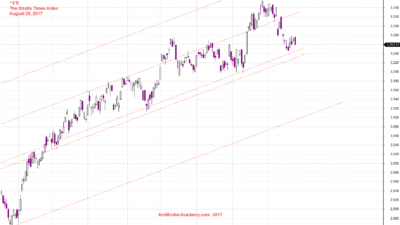
^STI The Straits Times Index and Channel
Picture worth a thousand words. Index is moving in zigzag. ST Index keeps forming higher high and higher low. The index is trapped within channel. The index is moving in layer.
Can ST index keep in the same channel? Will see.
August 25, 2017 The Straits Times Index and Channel
Thanks for visit the site here. You could also find free MACD scan here in this site too.
Moses
AmiBrokerAcademy.com
Disclaimer
The above result is for illustration purpose. It is not meant to be used for buy or sell decision. We do not recommend any particular stocks. If particular stocks of such are mentioned, they are meant as demonstration of Amibroker as a powerful charting software and MACD. Amibroker can program to scan the stocks for buy and sell signals.
These are script generated signals. Not all scan results are shown here. The MACD signal should use with price action. Users must understand what MACD and price action are all about before using them. If necessary you should attend a course to learn more on Technical Analysis (TA) and Moving Average Convergence Divergence, MACD.
Once again, the website does not guarantee any results or investment return based on the information and instruction you have read here. It should be used as learning aids only and if you decide to trade real money, all trading decision should be your own.