February 7, 2018
So, has Alibaba done anything different? Or it is no different, the stock just join the fall.
US Stock Analysis
BABA Alibaba Group Holding Charting
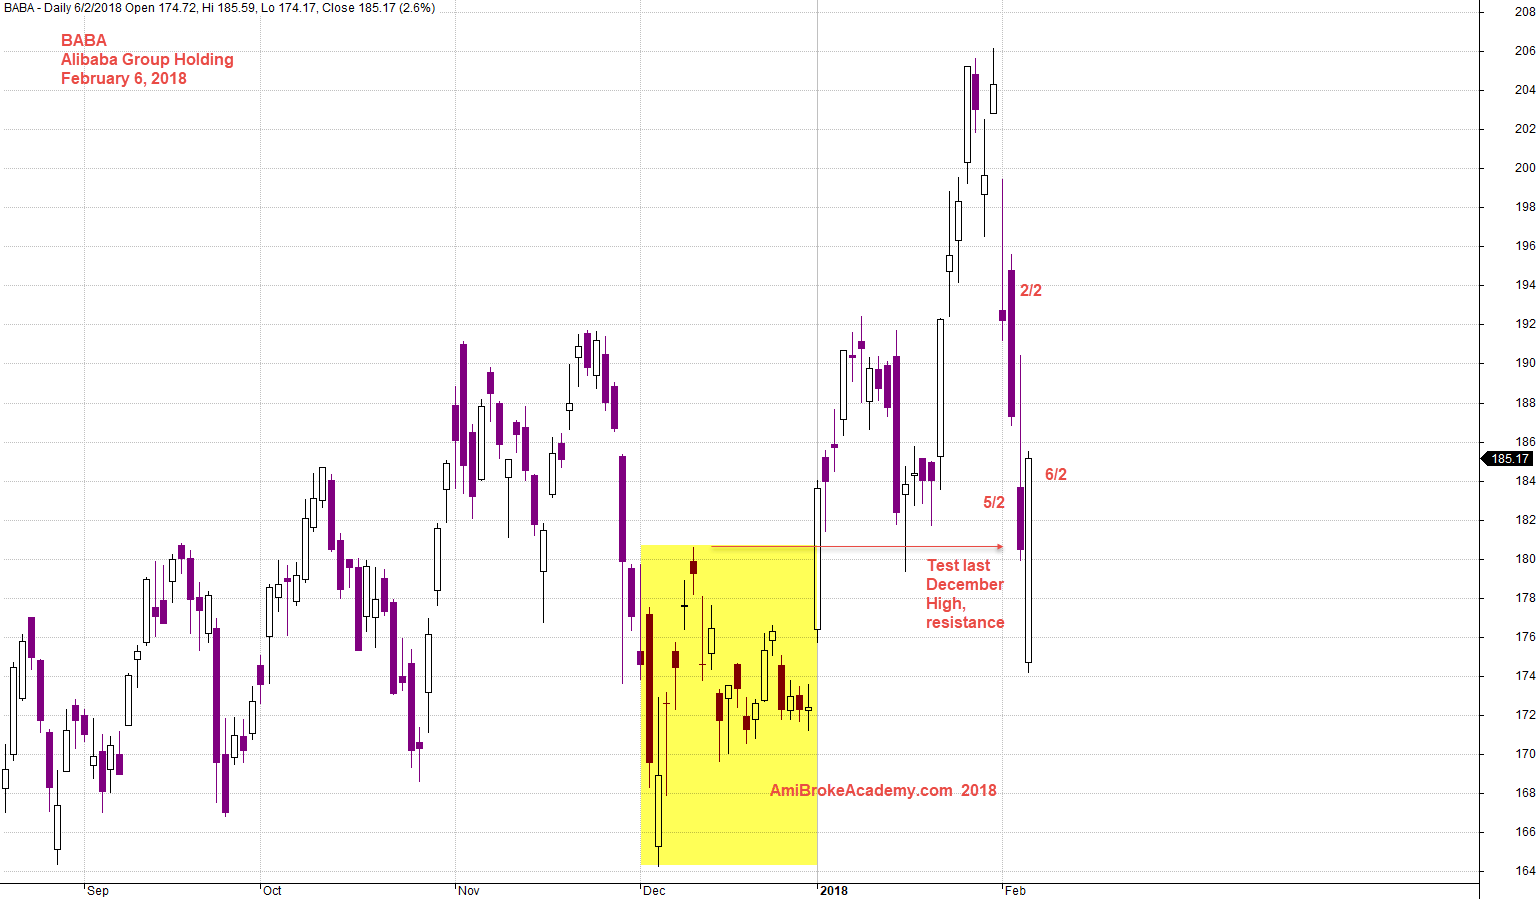
See chart, Alibaba Group Holding stock after two days deep, on the third day the price begin to re bounced. We had explained in our previous posting on why the stock price rebounce. Watch out for the next phase of deep.
Even there is a rebounce, the whole month (January) of hard work to push the price to 206, but only four days the price has brought down to slightly higher than last December high. Now the price is 185. See chart for more.
Manage your risk!
Powerful Chart Software – AmiBroker
The following chart is produced using AmiBroker charting software. It is a powerful chart software. You plot the stocks you are interested all in one chart, as long as you still could read them. See chart below.
February 6, 2018 Alibaba Group Holding Charting
Moses
AmiBrokerAcademy.com
Disclaimer
The above result is for illustration purpose. It is not meant to be used for buy or sell decision. We do not recommend any particular stocks. If particular stocks of such are mentioned, they are meant as demonstration of Amibroker as a powerful charting software and MACD. Amibroker can program to scan the stocks for buy and sell signals.
These are script generated signals. Not all scan results are shown here. The MACD signal should use with price action. Users must understand what MACD and price action are all about before using them. If necessary you should attend a course to learn more on Technical Analysis (TA) and Moving Average Convergence Divergence, MACD.
Once again, the website does not guarantee any results or investment return based on the information and instruction you have read here. It should be used as learning aids only and if you decide to trade real money, all trading decision should be your own.