January 17, 2018
This is another multilevel marketing structure company stock. Study the stock price and compare with other MLM stock for reference.
US Stock Analysis
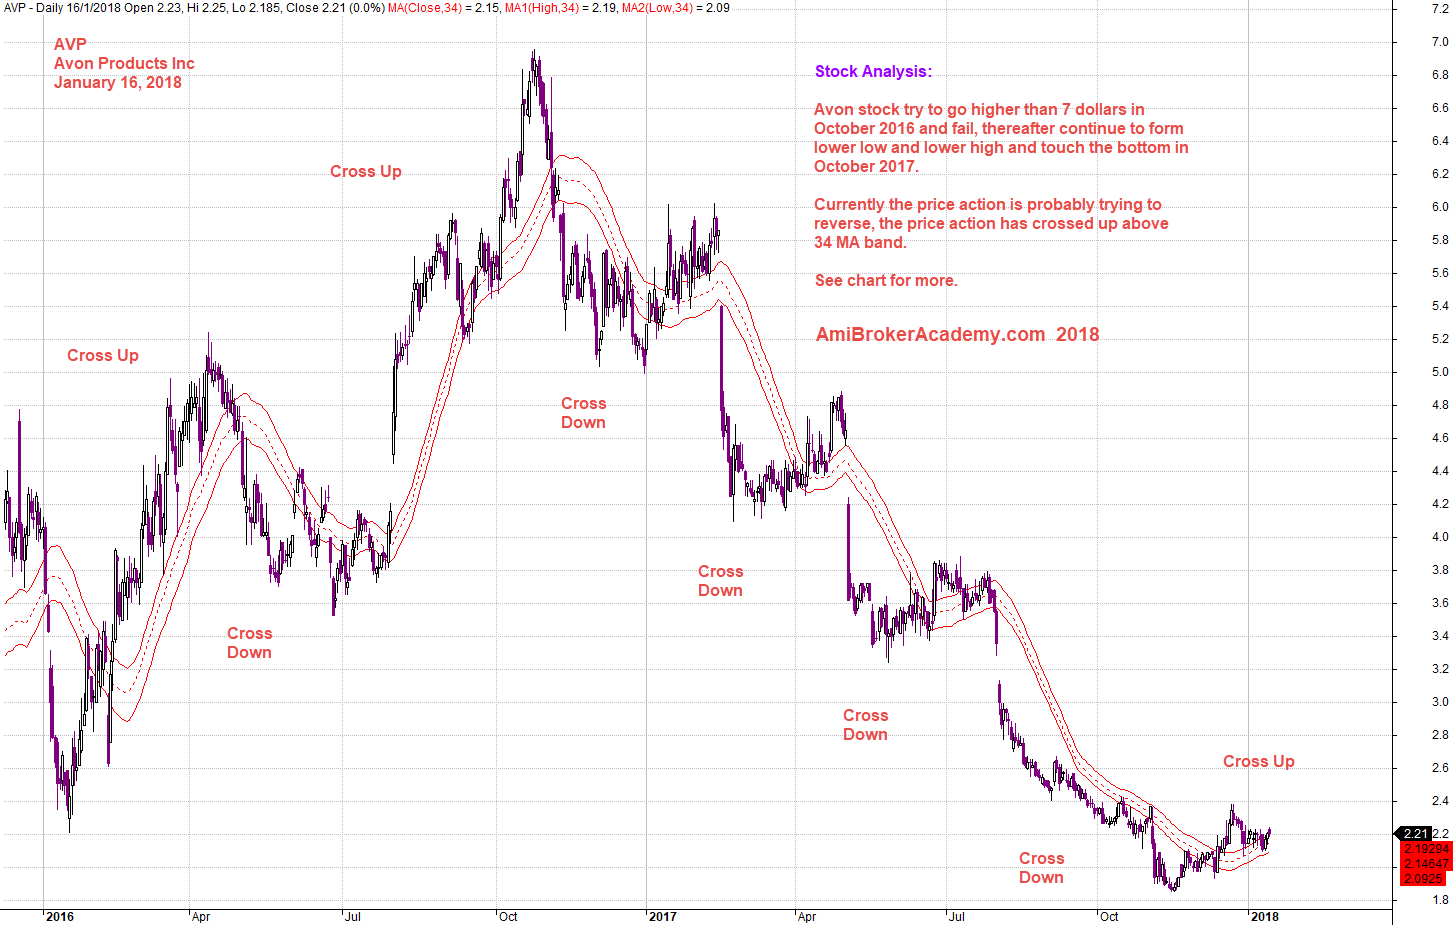
AVP Avon Products Inc and MA Band
Study the following chart and tell me, what is your trading plan? Buy or Sell.
If you use MA, or MA band, it is easily for your to see MA slop up, MA slop down. For the example below, you see the price cross up MA band and MA slopping up, bullish, You see stock price cross down MA, MA slopping down, bearish.
Now the stock price is quite low, and the stock price cross up MA band. If the stock price stay above the MA band and the MA band slopping up, it may be lower risk to enter, to catch the falling knife.
Manage your risk.
Powerful Chart Software – AmiBroker
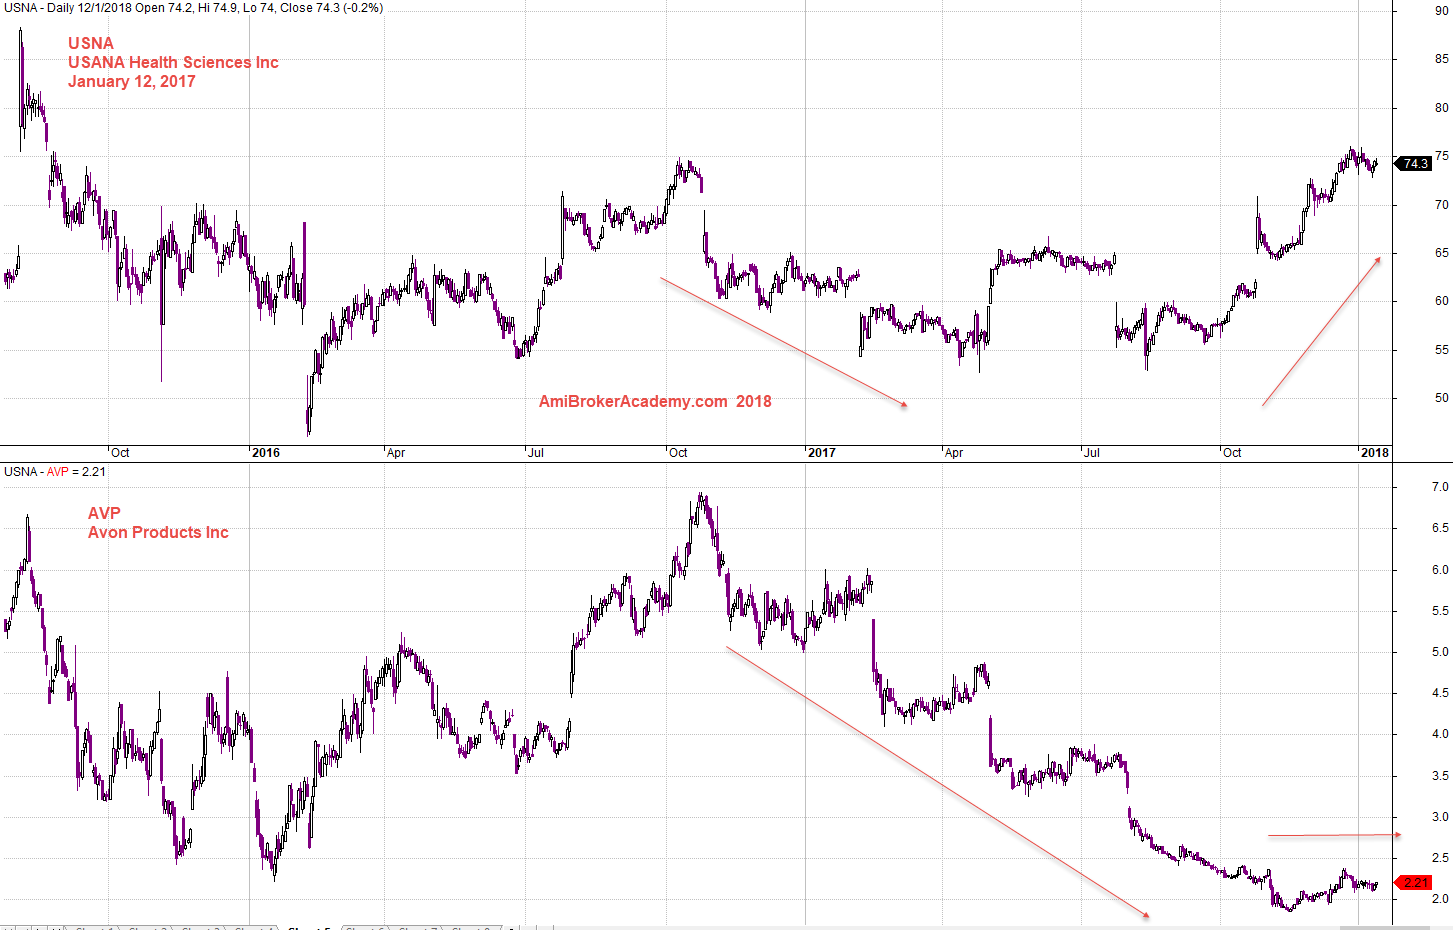
The following chart is produced using AmiBroker charting software. It is a powerful chart software. You plot the stocks you are interested all in one chart, as long as you still could read them. See chart below.
January 17, 2018 Avon Products Inc and MA Band
USANA Health Sciences and Avon Products Correlation
See chart, see both stock price had a decline in October 2016, but soon in April 2017 USANA managed to make a up turn although short term, but in October 2017 the stock price went bullish again. This is not the Avon case, the stock price continue to decline till after 2017 October.
So, correlation is a great tool for benchmarking two stocks or indexes. Have fun!
January 12, 2018 USANA Health Sciences and Avon Products Correlation
Herbalife and Nu Skin Correlation
From a correlation stand point, see chart both stock are in the similar trend.
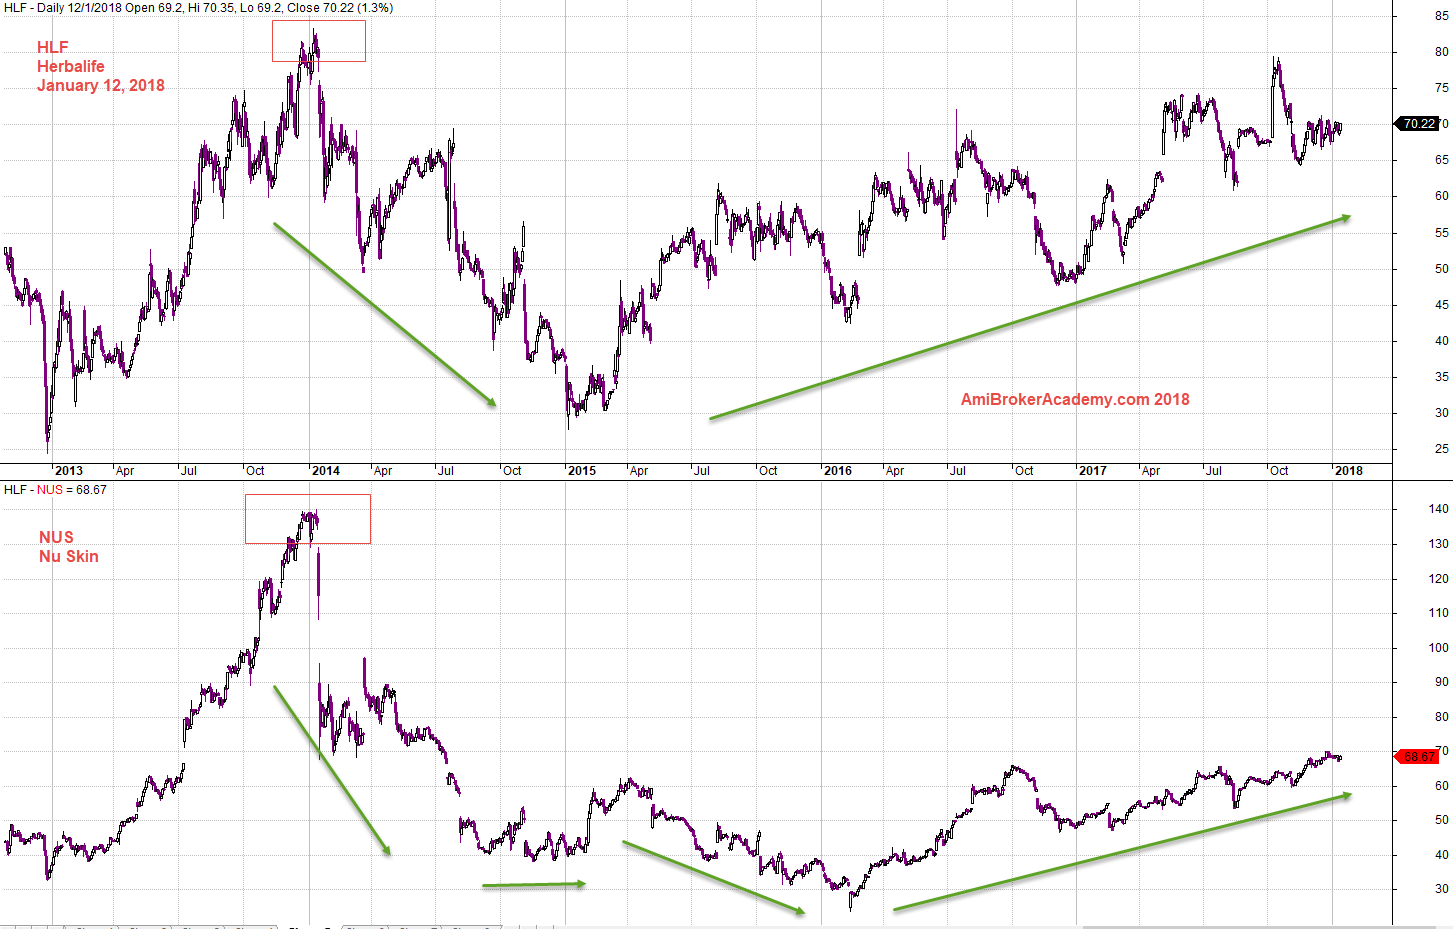
January 12, 2018 Herbalife and Nu Skin Correlation
Moses
AmiBrokerAcademy.com
Disclaimer
The above result is for illustration purpose. It is not meant to be used for buy or sell decision. We do not recommend any particular stocks. If particular stocks of such are mentioned, they are meant as demonstration of Amibroker as a powerful charting software and MACD. Amibroker can program to scan the stocks for buy and sell signals.
These are script generated signals. Not all scan results are shown here. The MACD signal should use with price action. Users must understand what MACD and price action are all about before using them. If necessary you should attend a course to learn more on Technical Analysis (TA) and Moving Average Convergence Divergence, MACD.
Once again, the website does not guarantee any results or investment return based on the information and instruction you have read here. It should be used as learning aids only and if you decide to trade real money, all trading decision should be your own.