June 29, 2017
Resistance turns Support! F&N Fraser and Neave
Did you buy near support! Or did you buy when the price action came back to retest the support again?
Picture worth a thousand words, You will find ABCD chart pattern, no just one. It demonstrate again. Trading become easy, if you could identify the ABCD chart pattern.
Enjoy your Trade.
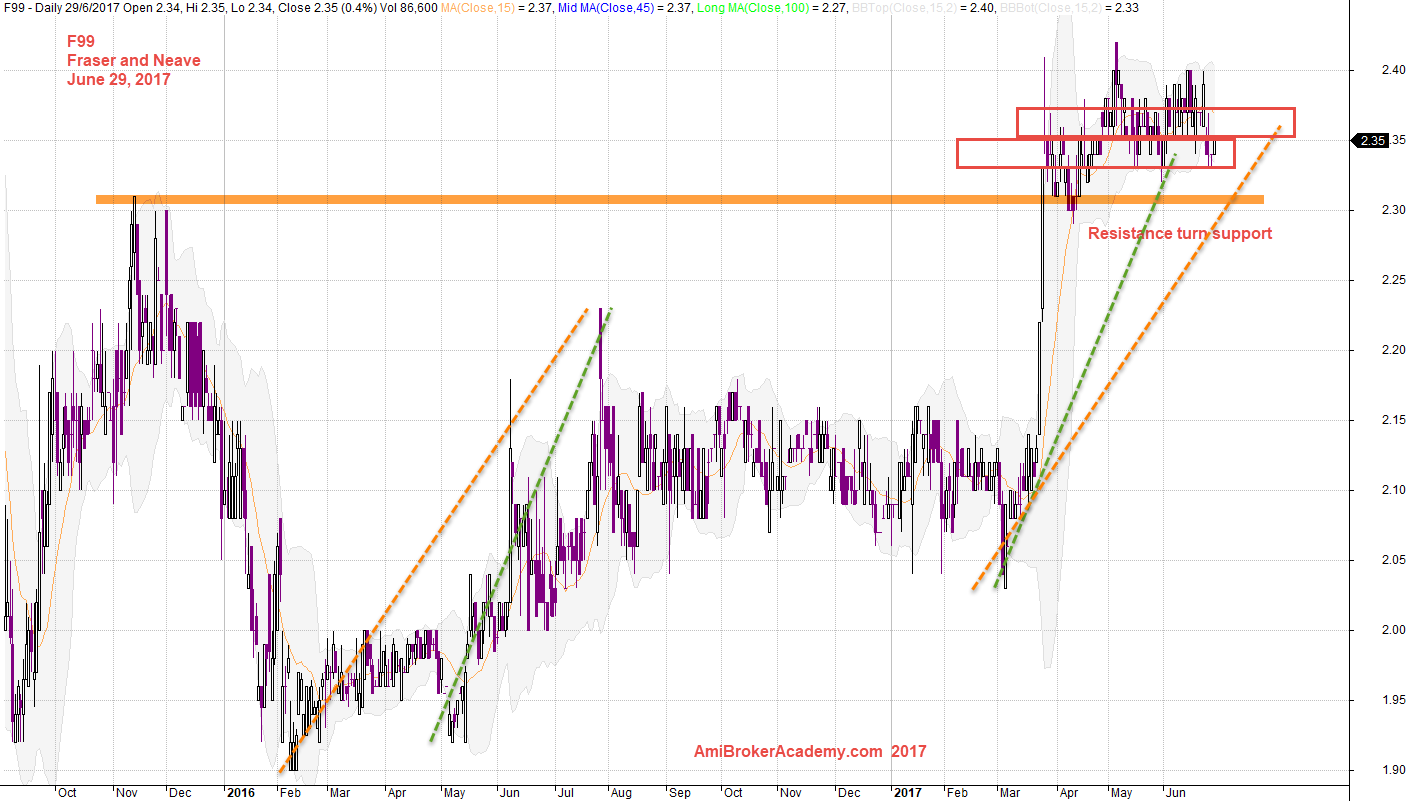
June 29, 2017 F&N Fraser and Neave and ABCD Chart Pattern
Moses Stock Analysis
AmiBrokerAcademy.com
Disclaimer
The above result is for illustration purpose. It is not meant to be used for buy or sell decision. We do not recommend any particular stocks. If particular stocks of such are mentioned, they are meant as demonstration of Amibroker as a powerful charting software and MACD. Amibroker can program to scan the stocks for buy and sell signals.
These are script generated signals. Not all scan results are shown here. The MACD signal should use with price action. Users must understand what MACD and price action are all about before using them. If necessary you should attend a course to learn more on Technical Analysis (TA) and Moving Average Convergence Divergence, MACD.
Once again, the website does not guarantee any results or investment return based on the information and instruction you have read here. It should be used as learning aids only and if you decide to trade real money, all trading decision should be your own.