Moses’s Free Singapore Stock MACD Scan – April 27, 2016
Welcome to Moses’s Free Singapore Stocks MACD Stock Scan at AmiBrokerAcademy.com. Thank you for visiting the site. You are here because you want to know why the stock moves or which stocks may move in the near future.
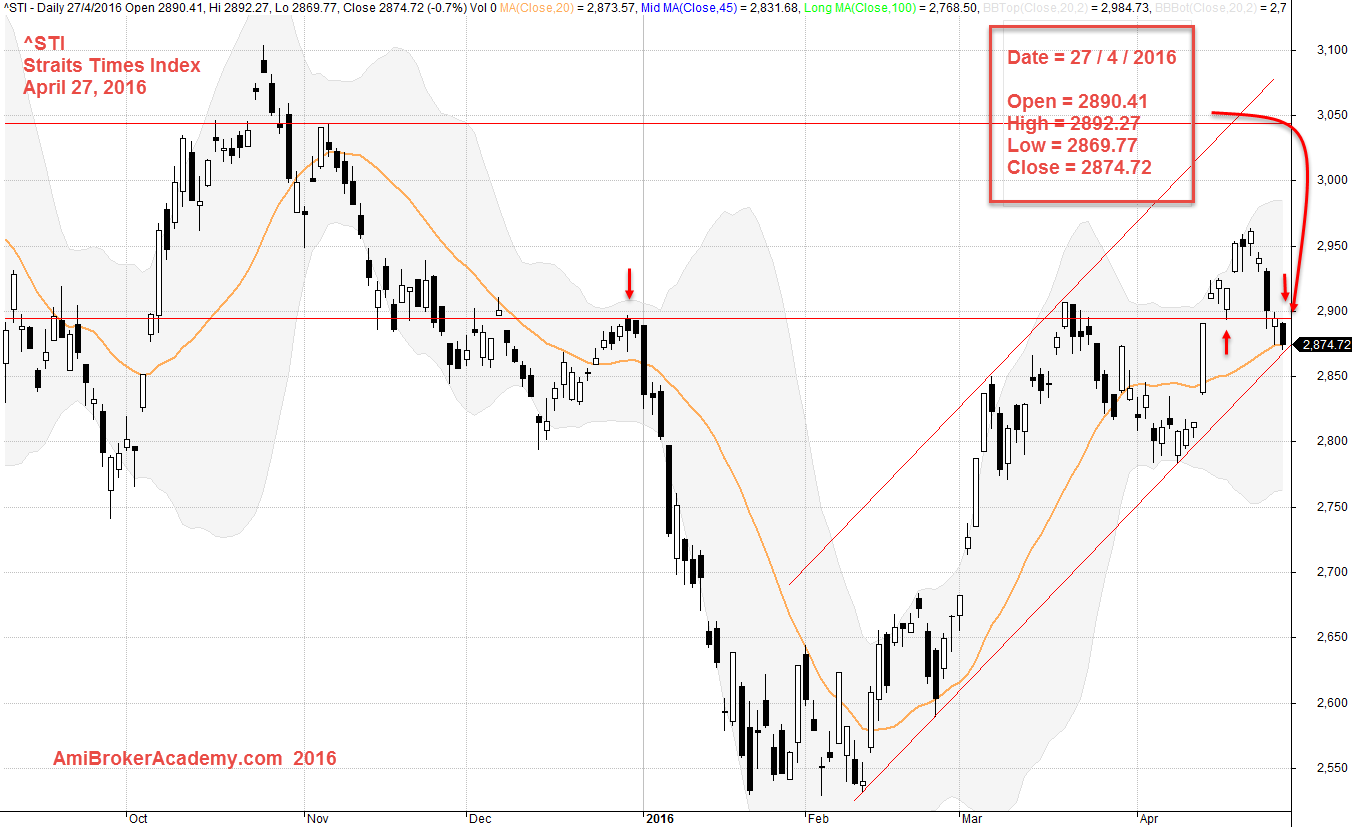
April 27 Singapore stocks MACD scan that has MACD bullish or bearish signals. The Singapore stock market benchmark, Straits Times Index closed at 2900.28 points. STI gap down and closed below open. Picture worth a thousand words.
Technical Analysis
Straits Times Index pullback and breakout below neckline. Is it the right shoulder breakout a whipsaw? Looks like the breakout fail.
Trading takes two sides; buy and sell. The trend moves north, because there are more buyer wanting to buy as compare to seller. Traders place their trade base on their believe. Trend is like big ship, it will take a lot of strength to change direction.
If you are new here, please check the previous posting on Straits Times Index analysis or other analysis.
Straits Times Index, ^STI
Inverted Head and Shoulders, is it reversal or pullback? Only until the index goes below the low. STI open 2890.41 points gap down and close lower, STI closed 2874.72 points.
April 27, 2016 Straits Times Index, ^STI
April 27, 2016 Free Singapore Stock MACD Scan Results
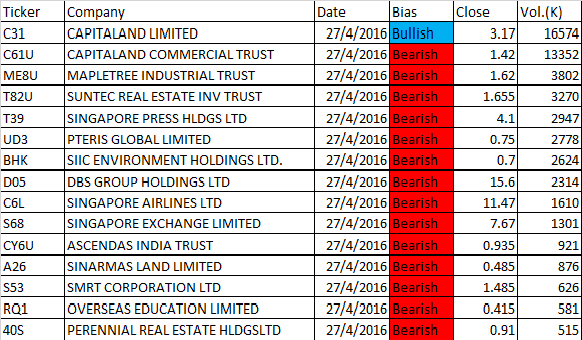
Eliminated stocks less than $0.35, and less than 500,000 stocks changed hand. Fifteen (15) stocks have MACD bullish or bearish signal. Out of 15 stocks, 1 stocks have bullish MACD signal and 14 stocks have bearish MACD signal. These are script generated results, sorted by volume. The market is very bearish, based on the MACD signals.
Moving Average Convergence Divergence
- MACD stands for Moving Average Convergence Divergence, the MACD line (red line or called fast line) and MACD signal line (blue line, or called slow line).
- MACD bullish signal when red line crosses above the blue line or MACD line crosses above zero line.
- MACD bearish signal when blue line crosses below red line or MACD line crosses below zero line.
The scanner helps to shortlist the stock for further technical analysis to determine the entry and exit point, and the risk involved.
April 27, 2016 Free Singapore Stock MACD Scan Results
The MACD screener is written using AmiBroker AFL script. AmiBroker is a powerful charting software.
Thanks for visiting the site, you can find many other analysis and concepts on this site. Have fun!
Moses Stock Analysis and Scan
Disclaimer: All information, data and material contained, presented, or provided on amibrokeracademy.com is for educational purposes only. It is not to be construed or intended as providing trading or legal advice. Decisions you make about your trading or investment are important to you and your family, therefore should be made in consultation with a competent financial advisor or professional. We are not financial advisor and do not claim to be. Any views expressed here-in are not necessarily those held by amibrokeracademy.com. You are responsible for your trade decision and wealth being.
The site uses powerful charting software, AmiBroker charting software.