April 24, 2017
Moses’ US Stock MACD Screening
The Following is the April 17 to 21 , 2017 US Stock MACD Screening Signals
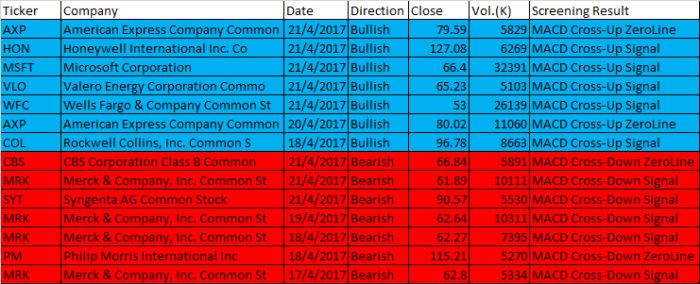
April 17 to 21, 2017 US Stock MACD Screening Signals
| Ticker | Company | Date | Direction | Close | Vol.(K) | Screening Result |
| AXP | American Express Company Common | 21/4/2017 | Bullish | 79.59 | 5829 | MACD Cross-Up ZeroLine |
| HON | Honeywell International Inc. Co | 21/4/2017 | Bullish | 127.08 | 6269 | MACD Cross-Up Signal |
| MSFT | Microsoft Corporation | 21/4/2017 | Bullish | 66.4 | 32391 | MACD Cross-Up Signal |
| VLO | Valero Energy Corporation Commo | 21/4/2017 | Bullish | 65.23 | 5103 | MACD Cross-Up Signal |
| WFC | Wells Fargo & Company Common St | 21/4/2017 | Bullish | 53 | 26139 | MACD Cross-Up Signal |
| AXP | American Express Company Common | 20/4/2017 | Bullish | 80.02 | 11060 | MACD Cross-Up ZeroLine |
| COL | Rockwell Collins, Inc. Common S | 18/4/2017 | Bullish | 96.78 | 8663 | MACD Cross-Up Signal |
| CBS | CBS Corporation Class B Common | 21/4/2017 | Bearish | 66.84 | 5891 | MACD Cross-Down ZeroLine |
| MRK | Merck & Company, Inc. Common St | 21/4/2017 | Bearish | 61.89 | 10111 | MACD Cross-Down Signal |
| SYT | Syngenta AG Common Stock | 21/4/2017 | Bearish | 90.57 | 5530 | MACD Cross-Down Signal |
| MRK | Merck & Company, Inc. Common St | 19/4/2017 | Bearish | 62.64 | 10311 | MACD Cross-Down Signal |
| MRK | Merck & Company, Inc. Common St | 18/4/2017 | Bearish | 62.27 | 7395 | MACD Cross-Down Signal |
| PM | Philip Morris International Inc | 18/4/2017 | Bearish | 115.21 | 5270 | MACD Cross-Down ZeroLine |
| MRK | Merck & Company, Inc. Common St | 17/4/2017 | Bearish | 62.8 | 5334 | MACD Cross-Down Signal |
What are the MACD Screening Signals?
The AFL script scans through the entire database to identify the following MACD signals.
- MACD line crosses above MACD signal – Bullish trend
- MACD line crosses above zero line – Bullish trend
- MACD Histogram +ve Divergence – Bullish trend
- MACD line crosses below MACD signal – Bearish trend
- MACD line crosses below zero line – Bearish trend
- MACD Histogram -ve Divergence – Bearish trend
- Volume traded greater 5,000,000 shares
- Stock between 51 dollars to 250 dollars.
.
Moses
AmiBrokerAcademy.com
Disclaimer
The above result is for illustration purpose. It is not meant to be used for buy or sell decision. We do not recommend any particular stocks. If particular stocks of such are mentioned, they are meant as demonstration of Amibroker as a powerful charting software and MACD. Amibroker can program to scan the stocks for buy and sell signals.
These are script generated signals. Not all scan results are shown here. The MACD signal should use with price action. Users must understand what MACD and price action are all about before using them. If necessary you should attend a course to learn more on Technical Analysis (TA) and Moving Average Convergence Divergence, MACD.
Once again, the website does not guarantee any results or investment return based on the information and instruction you have read here. It should be used as learning aids only and if you decide to trade real money, all trading decision should be your own.