April 24, 2017
Will Apple also join the rest in the correction mode?
Picture worth a thousand words, see April the price begin to declining.
Apple Inc Chart and 34 EMA Wave
Picture worth a thousand words.
The price is bounce off above the 34 EMA Wave. the price continue to form higher high till April.
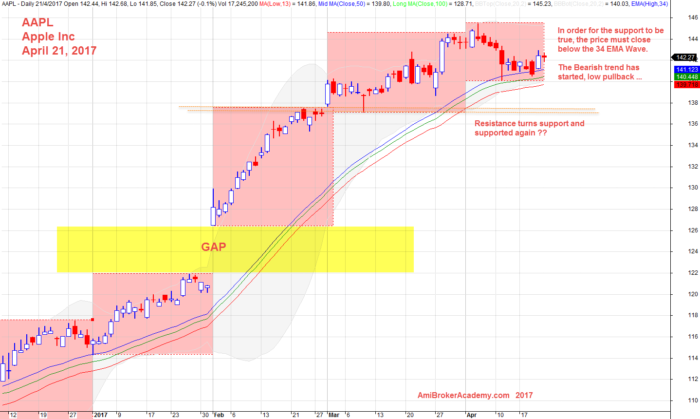
April 21, 2017 Apple Inc and 34 EMA Wave
Apple Inc Chart and MACD Indicator
MACD indicator has showed weakness, the strength is weaker. But the price is continue to form higher high.
There is a gap in Feb, will the gap covered. Good question.
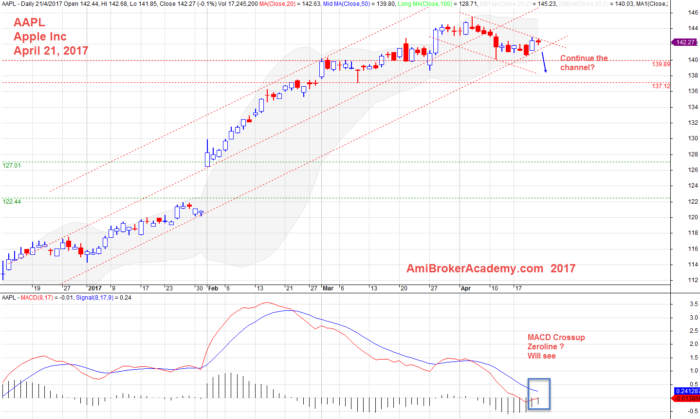
April 21, 2017 Apple Inc and MACD Indicator
Nothing is 100%!
Happy learning.
Moses Stock Analysis
AmiBrokerAcademy.com
Disclaimer
The above result is for illustration purpose. It is not meant to be used for buy or sell decision. We do not recommend any particular stocks. If particular stocks of such are mentioned, they are meant as demonstration of Amibroker as a powerful charting software and MACD. Amibroker can program to scan the stocks for buy and sell signals.
These are script generated signals. Not all scan results are shown here. The MACD signal should use with price action. Users must understand what MACD and price action are all about before using them. If necessary you should attend a course to learn more on Technical Analysis (TA) and Moving Average Convergence Divergence, MACD.
Once again, the website does not guarantee any results or investment return based on the information and instruction you have read here. It should be used as learning aids only and if you decide to trade real money, all trading decision should be your own.