March 18, 2016
Welcome to AmiBrokerAcademy.com.
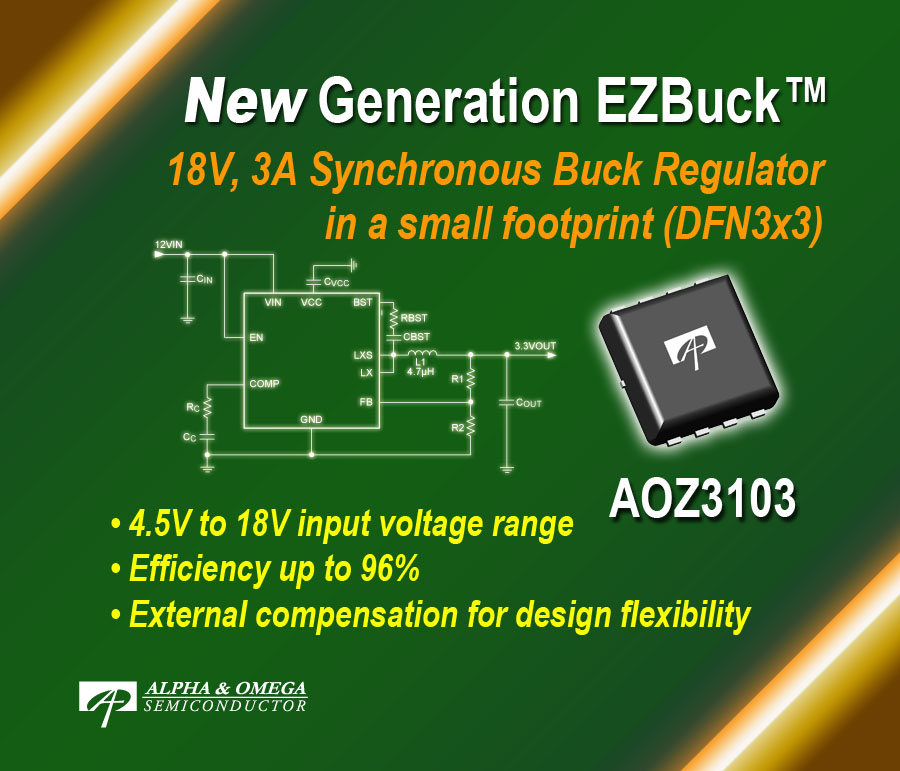
Photo from http://www.aosmd.com/
Picture Worth a Thousand Words – AOSL
If you can recall, a year ago, we analysed Alpha & Omega Semiconductor Limited, AOSL stock price. We saw a downtrend and followed by an uptrend. See the last posting for details. But, the stock again could not break higher. It retrace back to the support. Now the stock price formed an ABCD chart pattern. Will the stock price ending here.
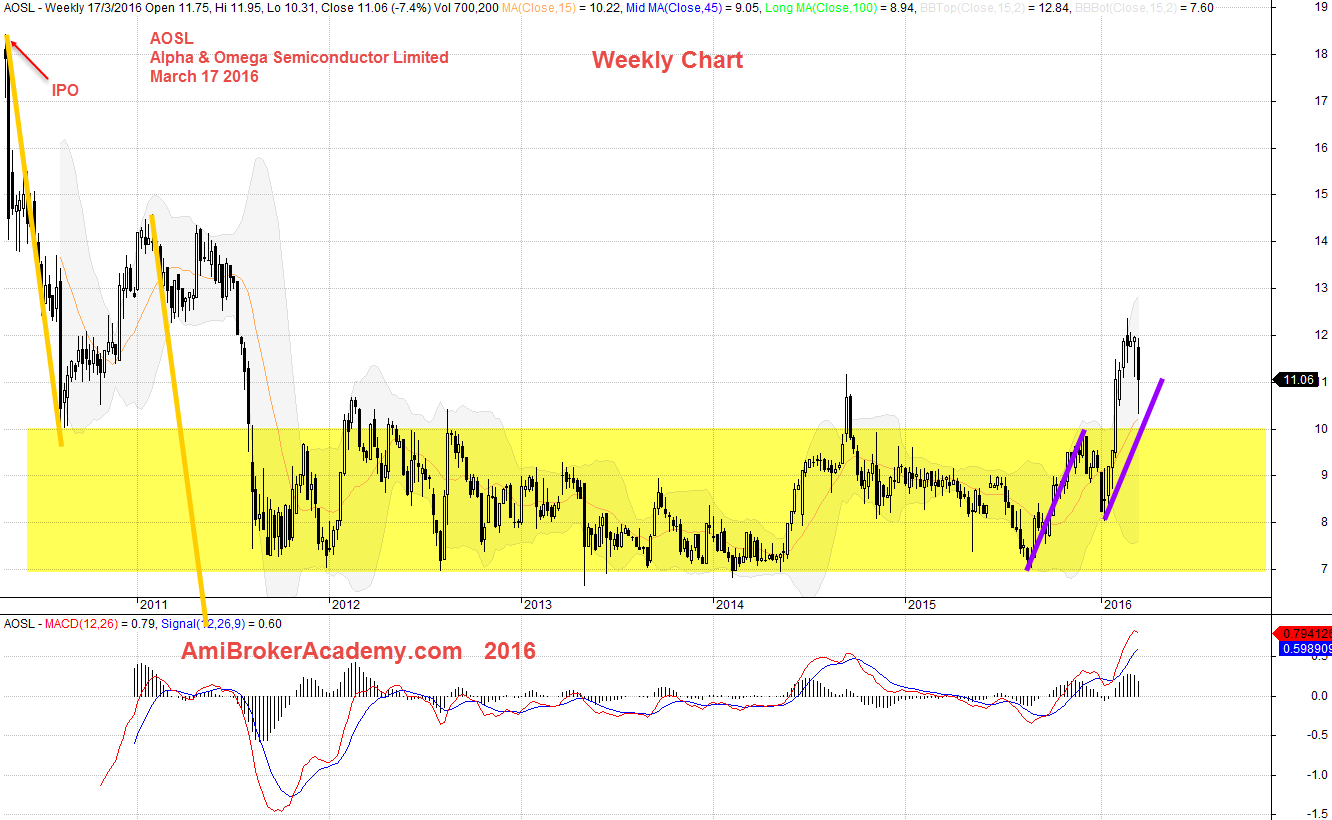
March 17, 2016 Alpha & Omega Semiconductor Since IPO Weekly Chart
Moses Stocks Analysis and Scan
Disclaimer: All information, data and material contained, presented, or provided on amibrokeracademy.com is for educational purposes only. It is not to be construed or intended as providing trading or legal advice. Decisions you make about your trading or investment are important to you and your family, therefore should be made in consultation with a competent financial advisor or professional. We are not financial advisor and do not claim to be. Any views expressed here-in are not necessarily those held by amibrokeracademy.com. You are responsible for your trade decision and wealth being.
Alpha and Omega Semiconductor HQ Office:
[mappress mapid=”2″]

Photo taken from Alpha & Omega Semiconductor webside, http://www.aosmd.com/about