February 7, 2018
Starting Friday 2nd February …
Last Friday US market leading the sell off, we had studied Microsoft, Alphabet (aka Google) stock price action. How about Amazon.com? Why study these few stocks? The answer is simple, these are the household stocks means nearly everyone know them. Do you want to know? …
US Stock Analysis
AMZN Amazon.com Inc Charting
See chart, Amazon stock seems not affected by the sell off pressure. Can this stand for the market movement? Will see.
Manage your risk!
Powerful Chart Software – AmiBroker
The following chart is produced using AmiBroker charting software. It is a powerful chart software. You plot the stocks you are interested all in one chart, as long as you still could read them. See chart below.
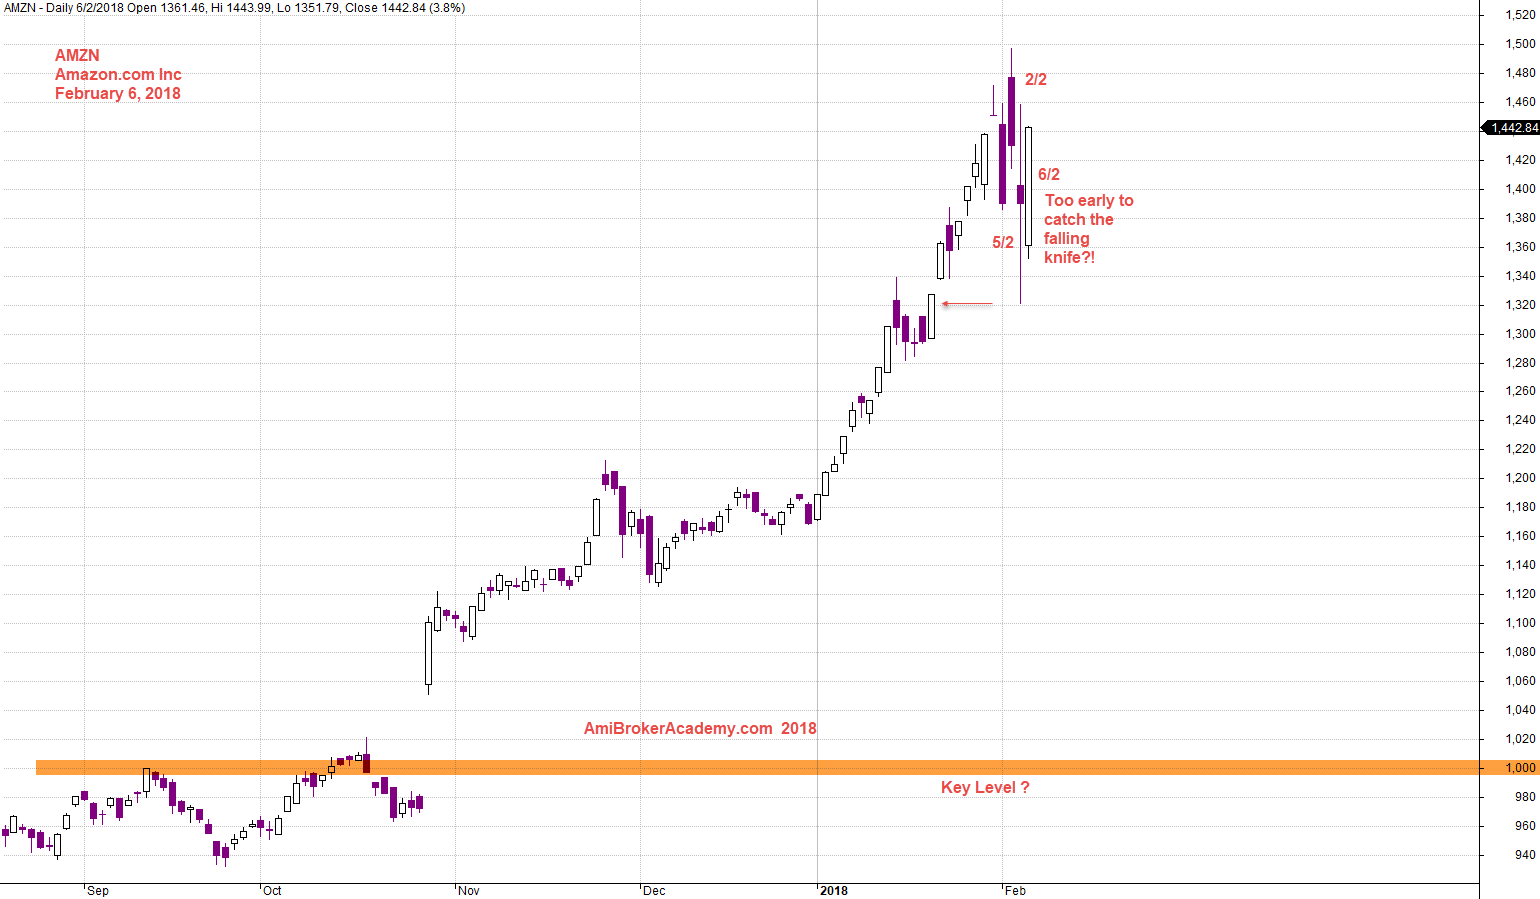
February 6, 2018 Amazon.com Charting
Moses
AmiBrokerAcademy.com
Disclaimer
The above result is for illustration purpose. It is not meant to be used for buy or sell decision. We do not recommend any particular stocks. If particular stocks of such are mentioned, they are meant as demonstration of Amibroker as a powerful charting software and MACD. Amibroker can program to scan the stocks for buy and sell signals.
These are script generated signals. Not all scan results are shown here. The MACD signal should use with price action. Users must understand what MACD and price action are all about before using them. If necessary you should attend a course to learn more on Technical Analysis (TA) and Moving Average Convergence Divergence, MACD.
Once again, the website does not guarantee any results or investment return based on the information and instruction you have read here. It should be used as learning aids only and if you decide to trade real money, all trading decision should be your own.