January 20, 2017
Singapore Stock Analysis | The Straits Times Index | AmiBrokerAcademy.com
Welcome to Moses’s Stock Analysis at AmiBrokerAcademy.com.
Twelve (12) Months The Straits Times Index Daily
It does not matter, your stock is part of the contributors to the results for the following chart, The Straits Times Index, ^STI 2016 twelve months. Using this to benchmark the stock you are working on is a good exercise. At least you know where your stock stand, good, bad or ugly.
The following can also seen as Singapore economy benchmark.
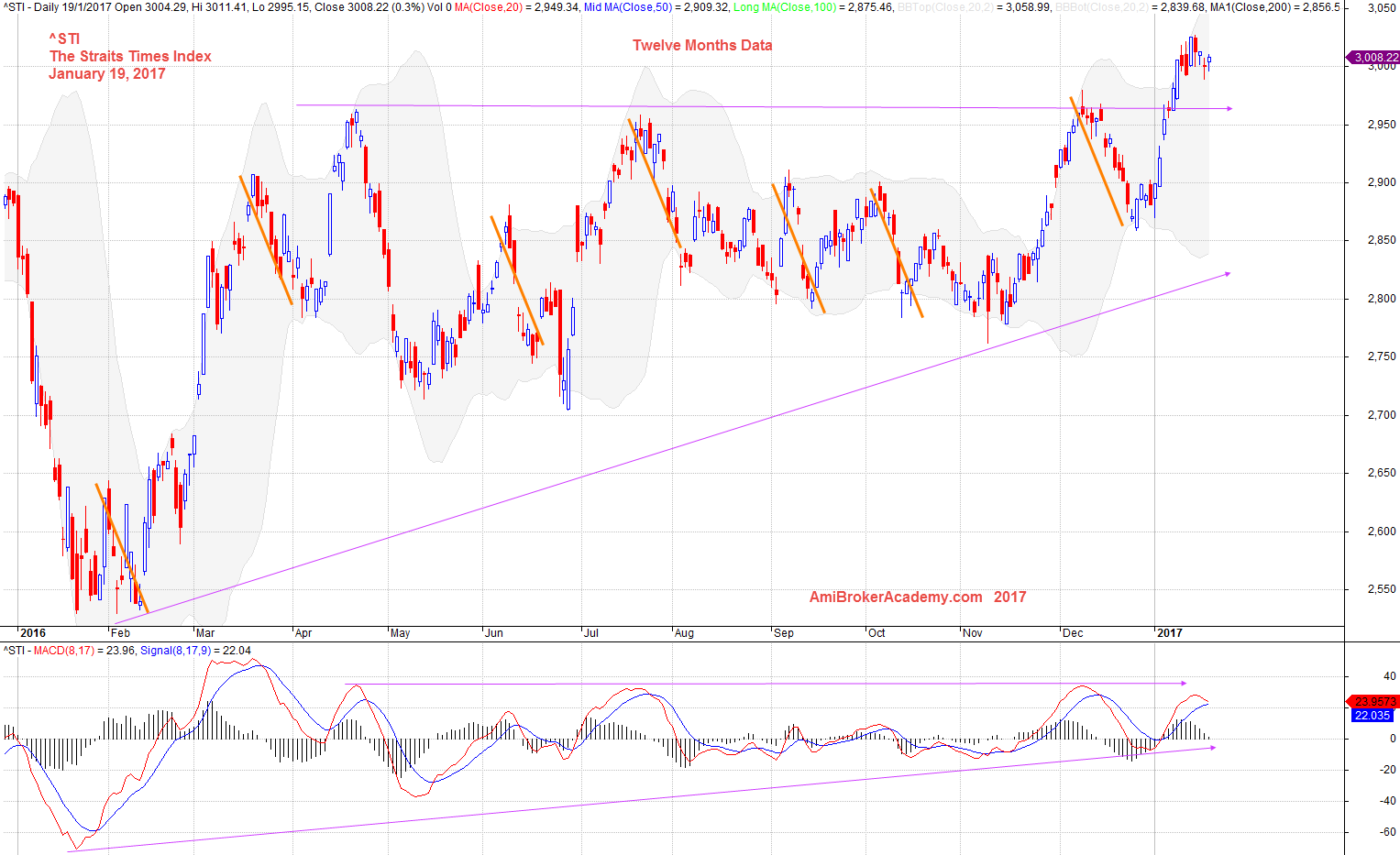
January 19, 2017 Twelve Months The Straits Times Index Daily
Moses
AmiBrokerAcademy.com
Disclaimer
The above result is for illustration purpose. It is not meant to be used for buy or sell decision. We do not recommend any particular stocks. If particular stocks of such are mentioned, they are meant as demonstration of Amibroker as a powerful charting software and MACD. Amibroker can program to scan the stocks for buy and sell signals.
These are script generated signals. Not all scan results are shown here. The MACD signal should use with price action. Users must understand what MACD and price action are all about before using them. If necessary you should attend a course to learn more on Technical Analysis (TA) and Moving Average Convergence Divergence, MACD.
Once again, the website does not guarantee any results or investment return based on the information and instruction you have read here. It should be used as learning aids only and if you decide to trade real money, all trading decision should be your own.