March 8, 2017
Today, March 8, International Women’s Day.
Welcome to Moses’s Singapore Stock Analysis @ AmiBrokerAcademy.com.
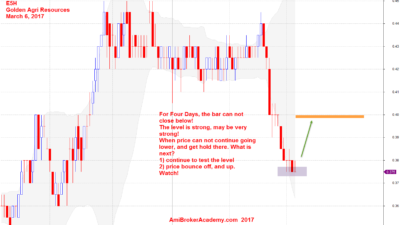
In the earlier posted on March 6, E5H anslysis, we see the stock was stop at the same level for four days.
E5H Golden Agri Resources Stock Analysis Update
March 6, 2017 Golden Agri Resources Update
After Stop at The Same Level for Four Days – E5H Golden Agri Resources Stock Breakout Lower
In order to go higher, first must go lower!
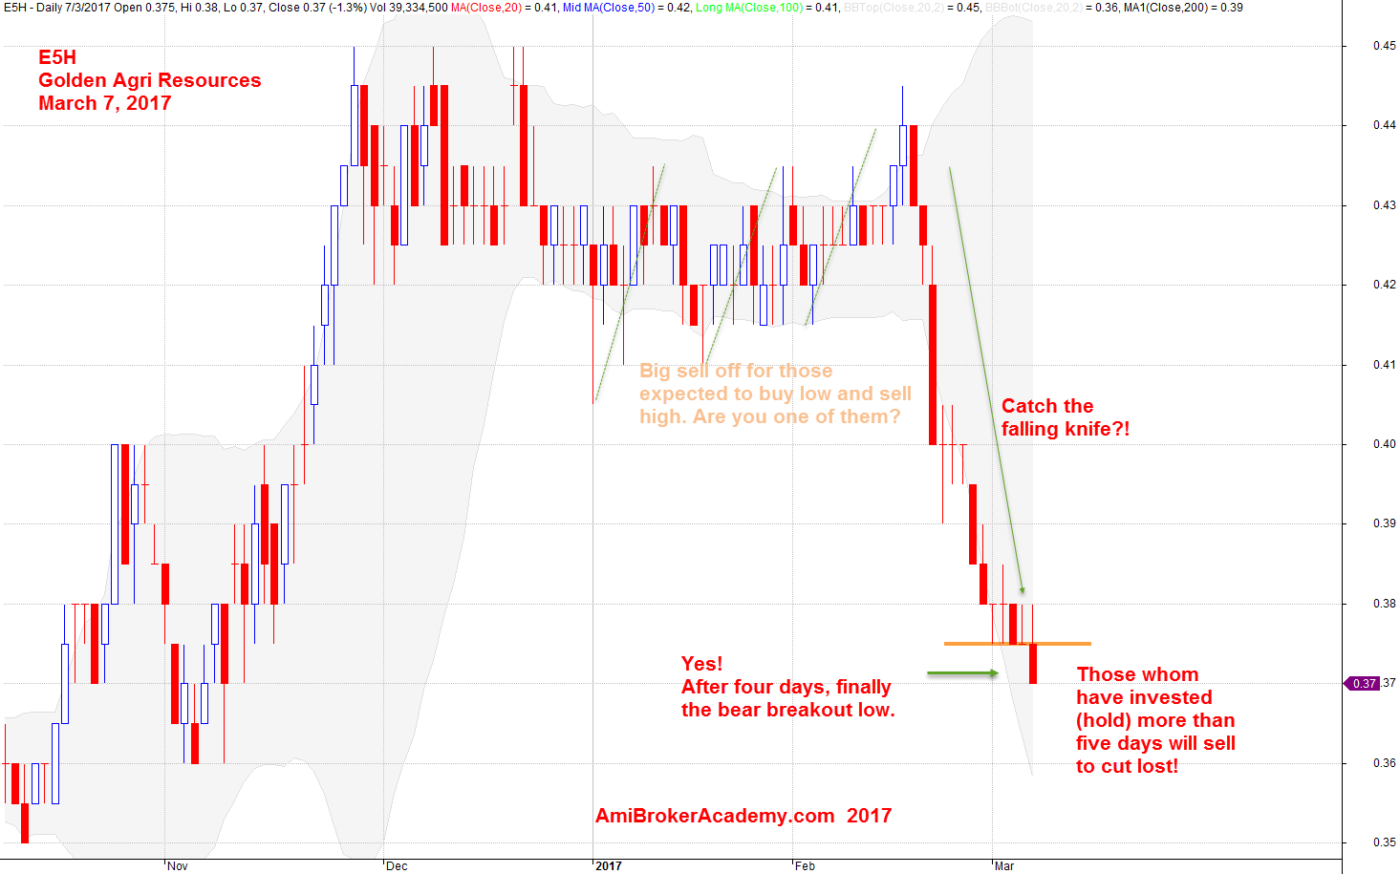
March 7, 2017 Golden Agri Resources after Four Days at the Same Level
Remember, we are only sharing the experience and for the education purpose. We do not provide buy or sell signal, please seek your trade adviser for their expert advice. You are responsible for your own action. Trading is personal, even you have enter the trade at the exact same manner, you may not make money. Trading is not a get rich fast business like many have advertise. It needs a lot of hard work and good money and risk management. Have fun! Happy learning.
Like What You Read?
Hope you enjoy our analysis! It is so simple. Read the current bar and look to your left and see where the bar is, inside the last bar? outside the last bar? Bull bar? Bear? What is the context of this bar?
In all cases, in a bull trend bull may be starting to take profit and bear start to sell. And more selling will resulting in less demand the price start to so weakness; price become lower.
We believe in no right no wrong. Our reasoning may not be the same as yours. Be it. Have fun!
The following capture what we watch Golden Agri Resources, we did not publish these analysis. And again, some many not even more comment. The thought is just instantaneous. Enjoy your reading.
Moses
AmiBrokerAcademy.com
Disclaimer
The above result is for illustration purpose. It is not meant to be used for buy or sell decision. We do not recommend any particular stocks. If particular stocks of such are mentioned, they are meant as demonstration of Amibroker as a powerful charting software and MACD. Amibroker can program to scan the stocks for buy and sell signals.
These are script generated signals. Not all scan results are shown here. The MACD signal should use with price action. Users must understand what MACD and price action are all about before using them. If necessary you should attend a course to learn more on Technical Analysis (TA) and Moving Average Convergence Divergence, MACD.
Once again, the website does not guarantee any results or investment return based on the information and instruction you have read here. It should be used as learning aids only and if you decide to trade real money, all trading decision should be your own.