May 31, 2017
Today, The Straits Times Index (STI) ended 6.03 points or 0.19% higher to 3210.82 points. Watch next week, the index pullback and bounce up.
ABCD Chart Pattern Gartley 222 Golden Agri Resources
Picture worth a thousand words. See the chart below, Golden Agri Resources. The Gartley 222 Buy Pattern so far working well, although the ab = cd missed. But will the next AB = CD will missed too, will see.
40 Cents is a possible good target!
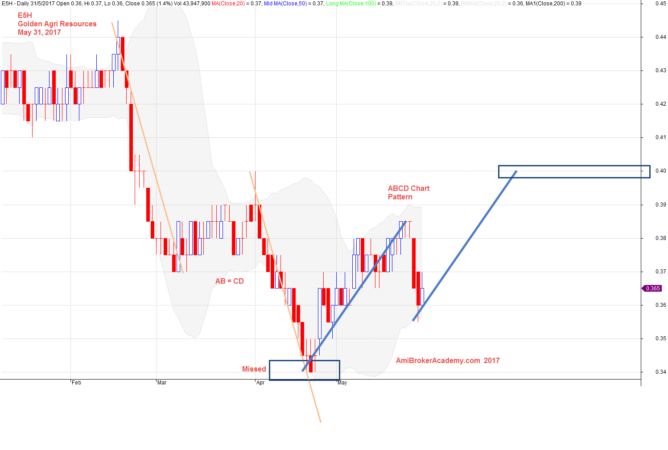
May 31, 2017 Golden Agri Resources and ABCD Chart Pattern.
Golden Agri Resources and MACD
Picture worth a thousand words, You see the trending ending, MACD divergence.
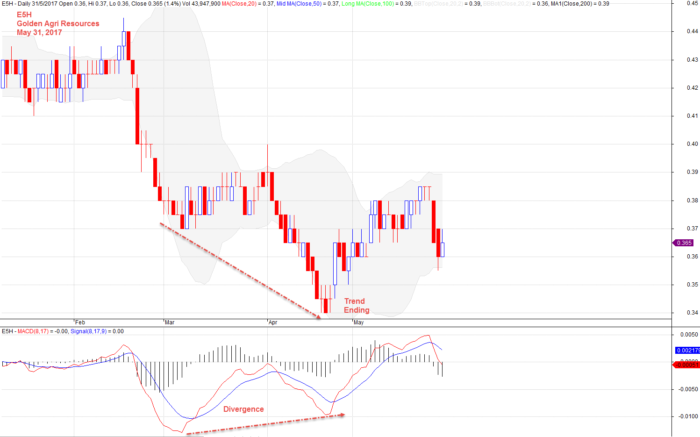
May 31, 2017 Golden Agri Resources and MACD
Moses Stock Analysis
AmiBrokerAcademy.com
Disclaimer
The above result is for illustration purpose. It is not meant to be used for buy or sell decision. We do not recommend any particular stocks. If particular stocks of such are mentioned, they are meant as demonstration of Amibroker as a powerful charting software and MACD. Amibroker can program to scan the stocks for buy and sell signals.
These are script generated signals. Not all scan results are shown here. The MACD signal should use with price action. Users must understand what MACD and price action are all about before using them. If necessary you should attend a course to learn more on Technical Analysis (TA) and Moving Average Convergence Divergence, MACD.
Once again, the website does not guarantee any results or investment return based on the information and instruction you have read here. It should be used as learning aids only and if you decide to trade real money, all trading decision should be your own.