January 13, 2017
Singapore Stock Analysis
E5H | Golden Agri Resources Stock Analysis
Price action bounce off the 34 EMA wave, 34 EMA Wave is pointing on between 2 to 3 o’clock direction. It is still bullish, except might me ranging.
From an ABCD chart pattern, there is a potential up side and may reach between 49 cent to 50 cent.
We see a triple top follow a pullback and supported by the 34 EMA wave.
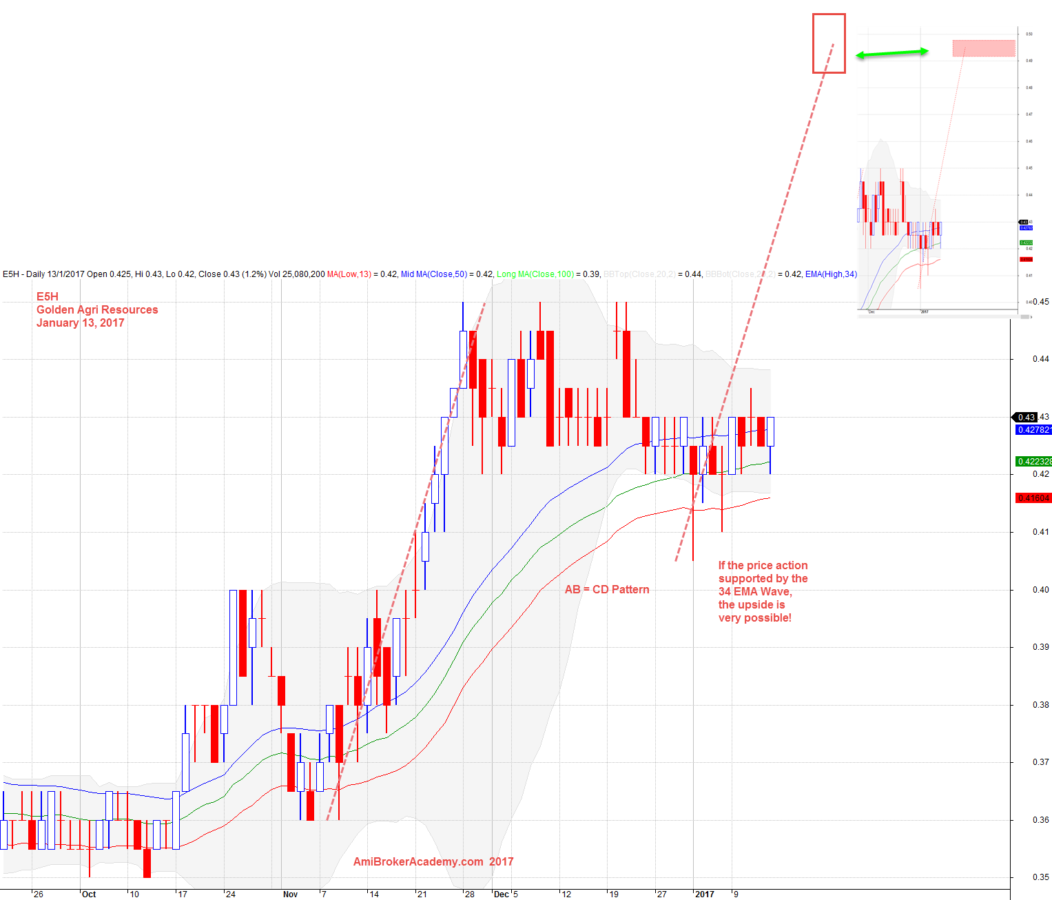
January 13, 2017 Golden Agri Resources Daily and AB=CD Chart Pattern
E5H | Zoom In for Golden Agri Resources
After the triple top, the price action pullback. Where can the CD leg land? If AB=CD pattern does not fail, at least the price action can land around 49 to 50 cents.
Picture shows (worth) a thousand words.
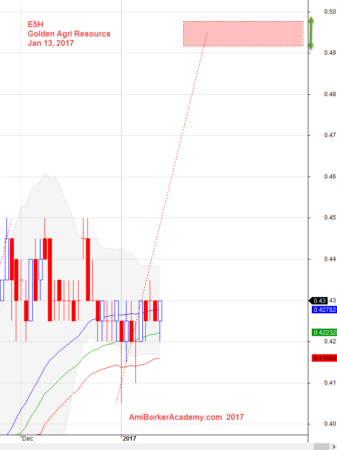
January 13, 2017 Golden Agri Resources Daily and a Zoom In for CD Leg
Moses Stock Desk
AmiBrokerAcademy.com
Disclaimer:
The discussion here is for educational purposes only. All information, data, symbols and trading ideas discussed hereby are the author or authors intend to demonstrate or illustrate purposes only. These are not recommendations or advice. It is not to be construed or intended as providing trading or legal advice.
Besides that this discussion is not an offer or solicitation of any kind in any jurisdiction where any AmiBrokerAcademy.com or its affiliate is try to do business.
Please note that active trading is not suitable for everyone. Any decisions you make about your trading or investment are important to you and your family, therefore should be made in consultation with a competent financial advisor or professional. We are not financial advisor and do not claim to be one.
Any views expressed here-in are not necessarily those held by amibrokeracademy.com.