August 7, 2017
AAV Advantage Oil and Gas and 34 MA Band
See chart for more, picture worth a thousand words.
PA crosses above 34 MA, crosses below 34 MA, and crosses up and cross between 34 MA. So, it is clearly the price action from bullish, to bearish to sideways.
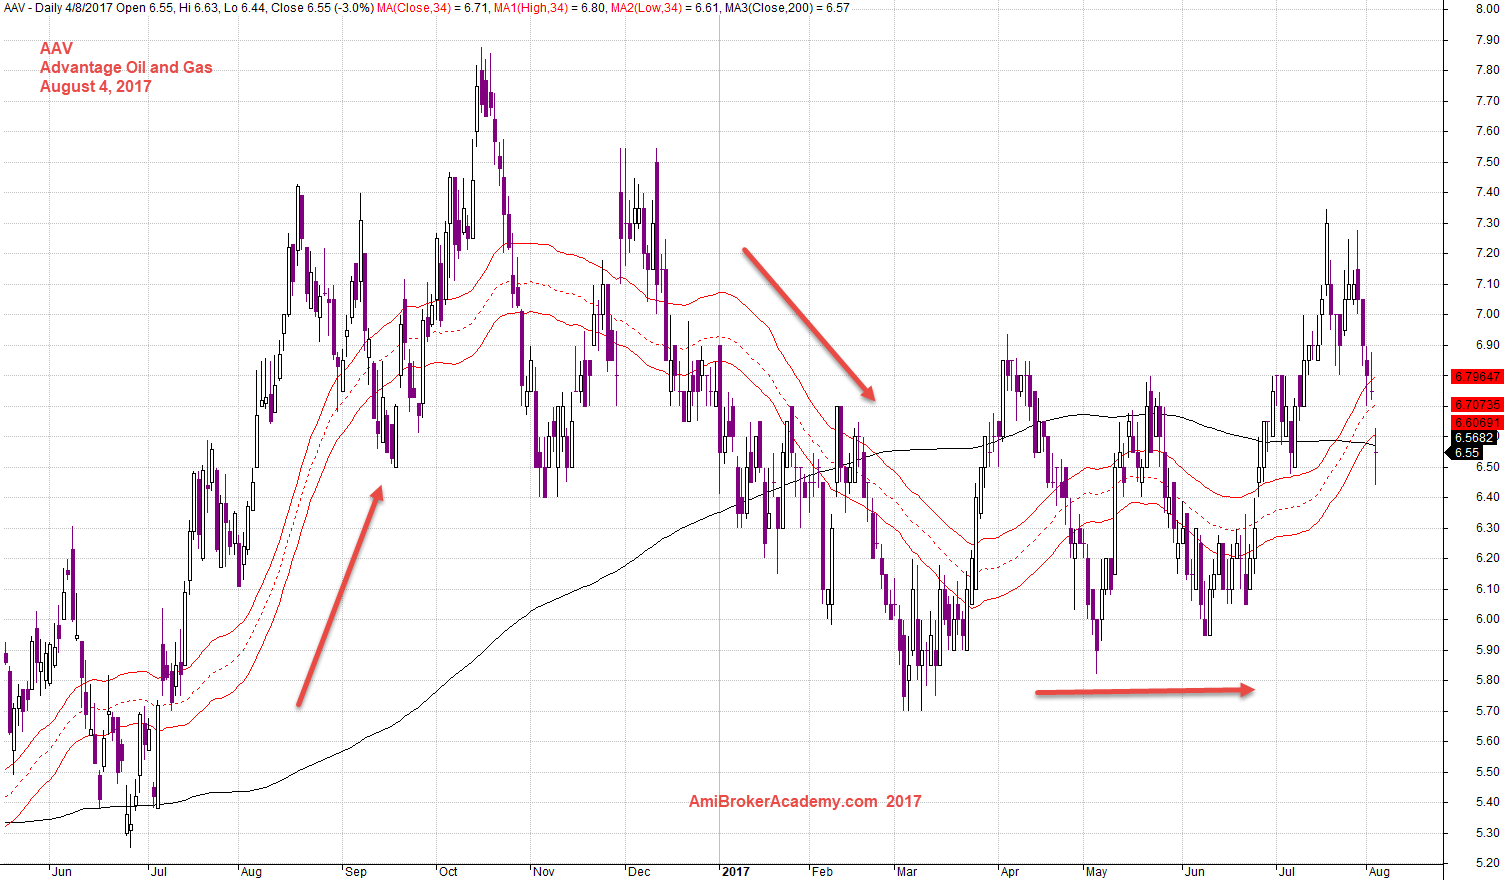
August 4, 2017 Advantage Oil and Gas and 34 MA Band
AAV Advantage Oil and Gas and Channel
See chart for more, picture worth a thousand words.
Connecting the low, and draw parallel lines, these form channel. The channel slopping from bottom left to top right. So, this is bullish.
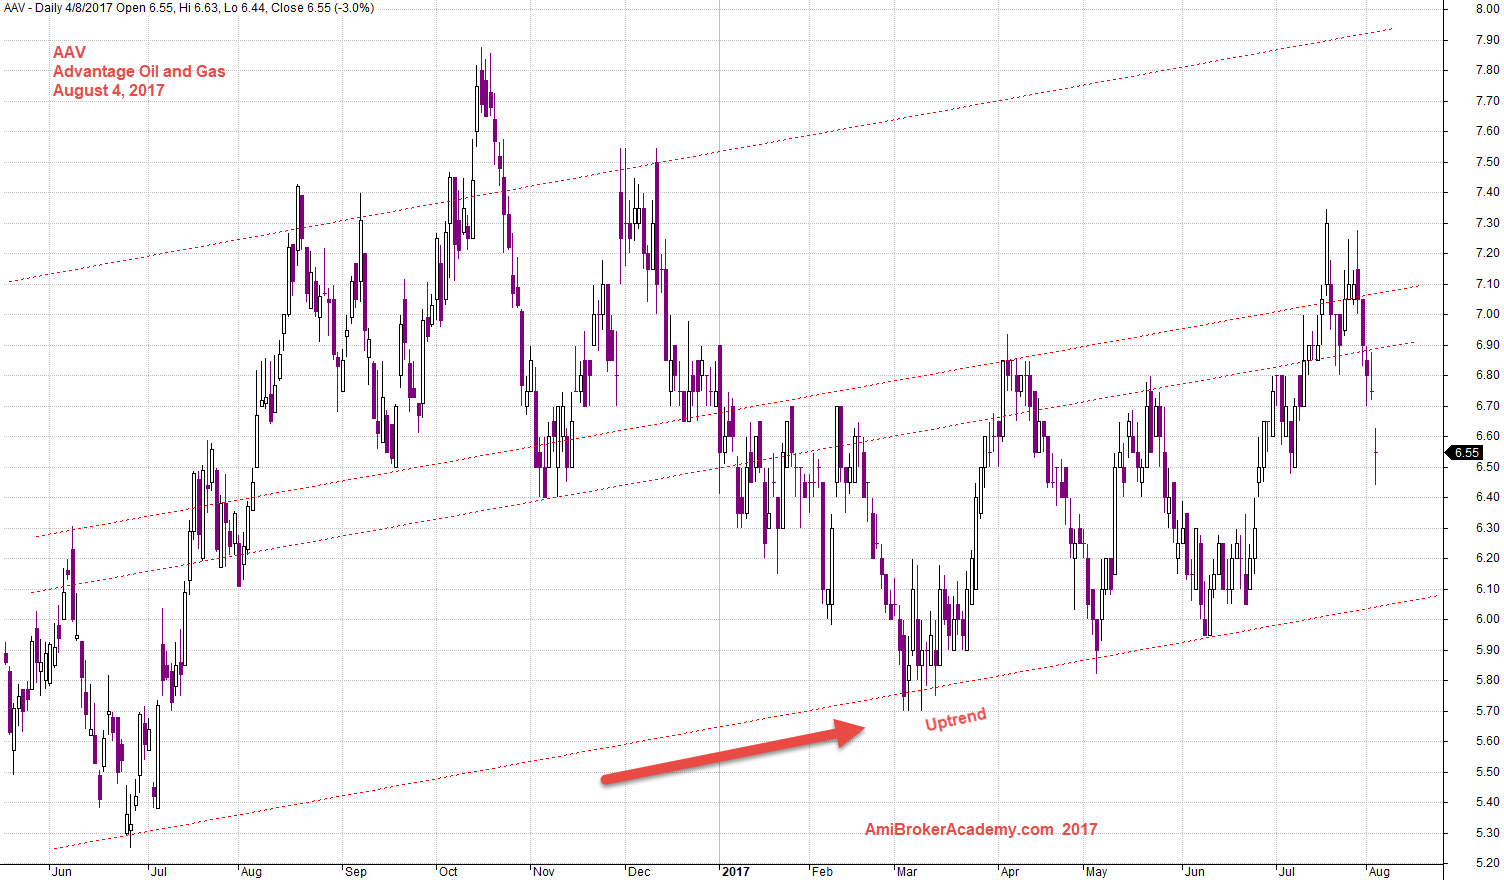
August 4, 2017 Advantage Oil and Gas and Channel
Thanks for visit the site here. You could also find free MACD scan here in this site too.
Moses
AmiBrokerAcademy.com
Disclaimer
The above result is for illustration purpose. It is not meant to be used for buy or sell decision. We do not recommend any particular stocks. If particular stocks of such are mentioned, they are meant as demonstration of Amibroker as a powerful charting software and MACD. Amibroker can program to scan the stocks for buy and sell signals.
These are script generated signals. Not all scan results are shown here. The MACD signal should use with price action. Users must understand what MACD and price action are all about before using them. If necessary you should attend a course to learn more on Technical Analysis (TA) and Moving Average Convergence Divergence, MACD.
Once again, the website does not guarantee any results or investment return based on the information and instruction you have read here. It should be used as learning aids only and if you decide to trade real money, all trading decision should be your own.