July 21, 2017
Apple Inc stock is a very good investment. Have fun!
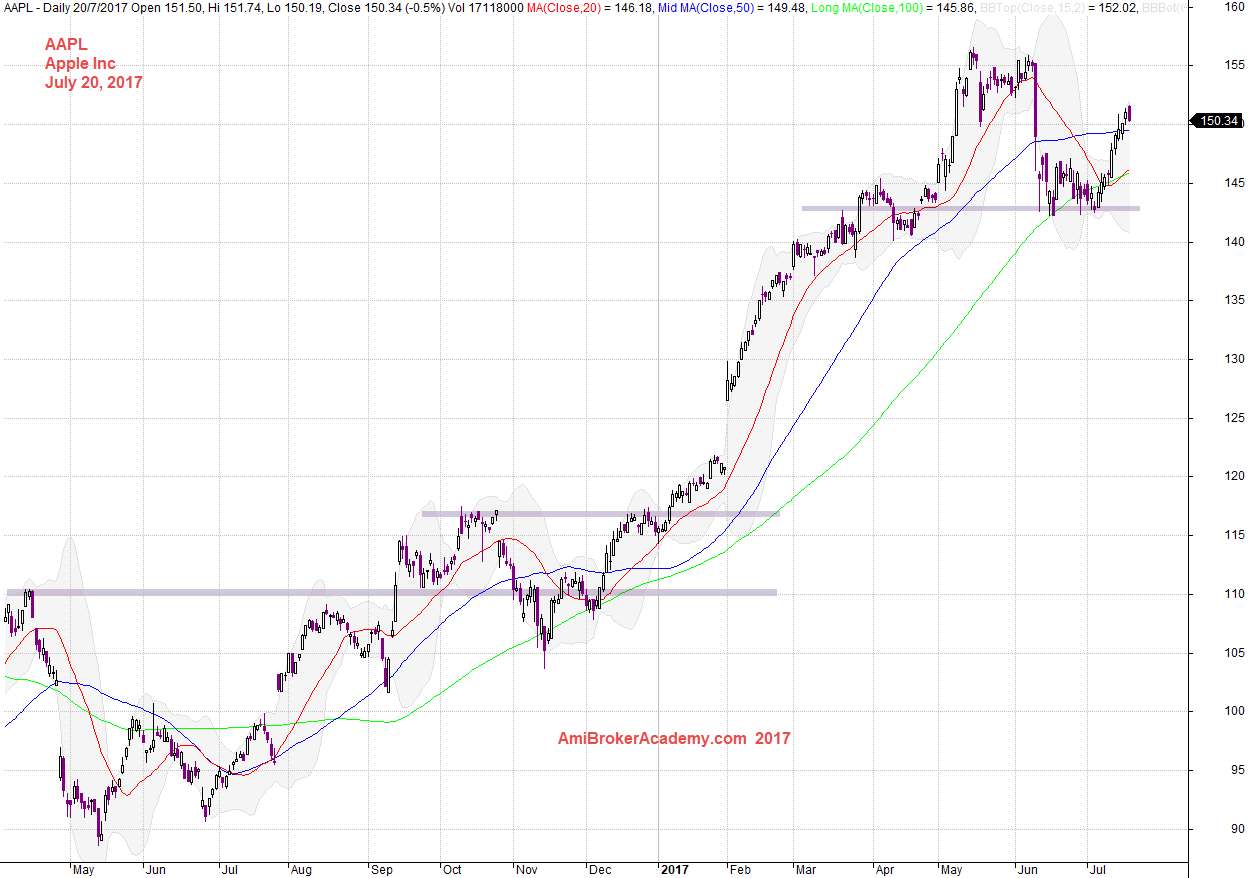
AAPL Apple Inc and Major Levels
See chart for more, picture worth a thousand words.
Resistance turns support, breakout resistance, … Apple Inc stock very bullish. But after bullish, the price pullback in June to test the resistance. The price does not just test once, it tested twice. See chart for more.
The share price is very bullish. Professional trader buy low sell high. How to buy low? Buy retracement. So wait to buy retracement.
If you study the chart, you will see there was an opportunities for you to buy low. That was mid June and early July. If you missed the opportunity than wait.
Have you jump in when the window open? Likely not. It is easy say than done. Fear, or greedy may be the main cause for you to miss the window. You are waitting for lower price, the price to be lower and you miss it. Haha.
July 20, 2017 Apple Inc and Major Levels
Apple Inc and Channel
Channel is a great visual tool to recognize the trend direction, bullish trend or bearish trend. The current chart, the channel is slopping from the bottom left to top right. Add the channel lines, you can easily see the trend direction.
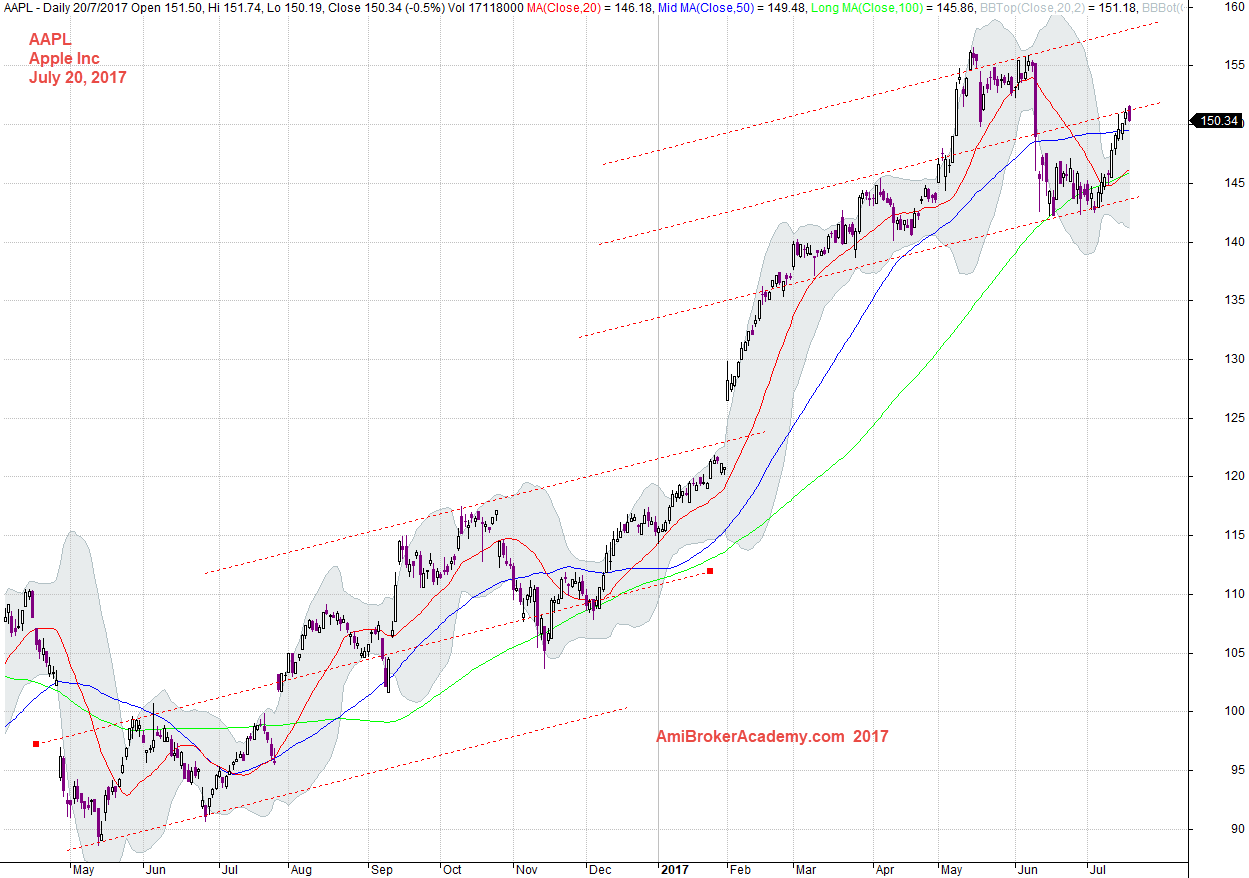
July 20, 2017 Apple Inc and Channel
Apple Inc and 34 MA Band
Moving average is great visual tool. Moving Average Band will be even better. See chart for more.
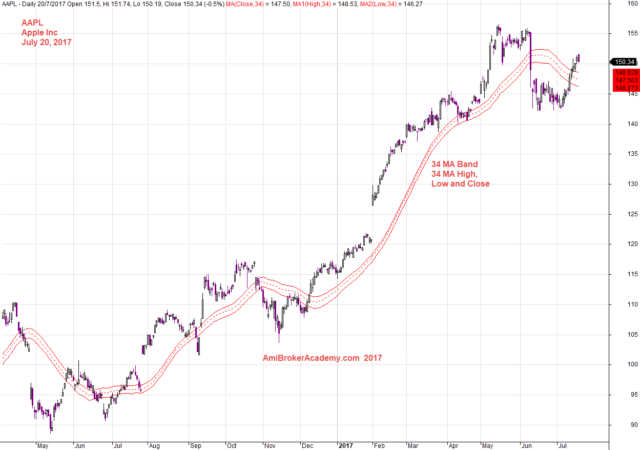
July 20, 2017 Apple Inc and 34 Moving Average Band
Apple Inc and MACD Signals
Trend ending? Will see.
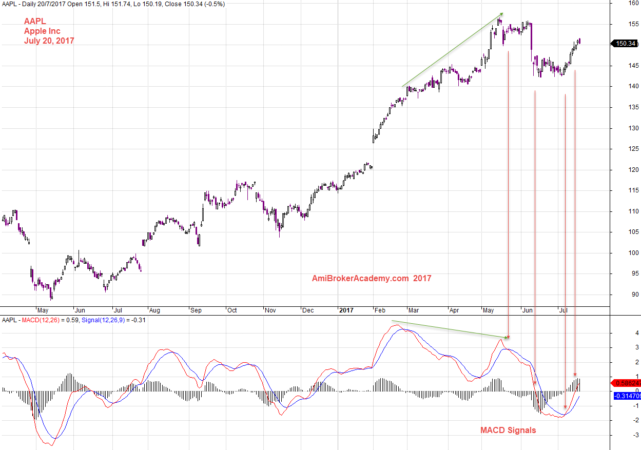
July 20, 2017 Apple Inc and MACD Signals
Thanks for visit the site here. You could also find free MACD scan here in this site too.
Moses
AmiBrokerAcademy.com
Disclaimer
The above result is for illustration purpose. It is not meant to be used for buy or sell decision. We do not recommend any particular stocks. If particular stocks of such are mentioned, they are meant as demonstration of Amibroker as a powerful charting software and MACD. Amibroker can program to scan the stocks for buy and sell signals.
These are script generated signals. Not all scan results are shown here. The MACD signal should use with price action. Users must understand what MACD and price action are all about before using them. If necessary you should attend a course to learn more on Technical Analysis (TA) and Moving Average Convergence Divergence, MACD.
Once again, the website does not guarantee any results or investment return based on the information and instruction you have read here. It should be used as learning aids only and if you decide to trade real money, all trading decision should be your own.