October 13, 2017
AAPL Apple Inc and ABCD Chart Pattern
See chart for more, picture worth a thousand words.
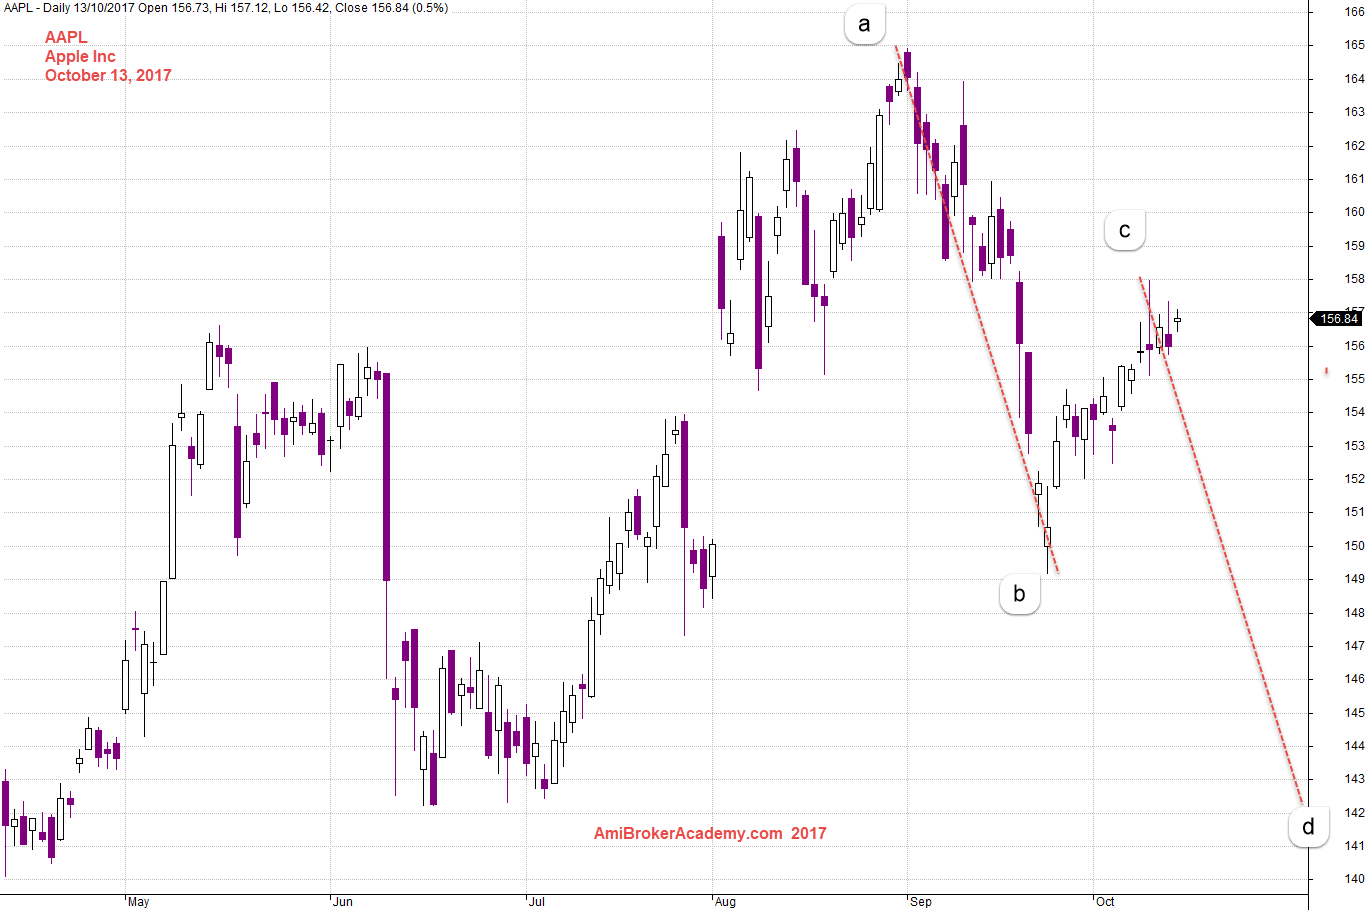
October 13, 2017 Apple Inc and ABCD Chart Pattern
AAPL Apple Inc and Bar by Bar
See chart for more, picture worth a thousand words.
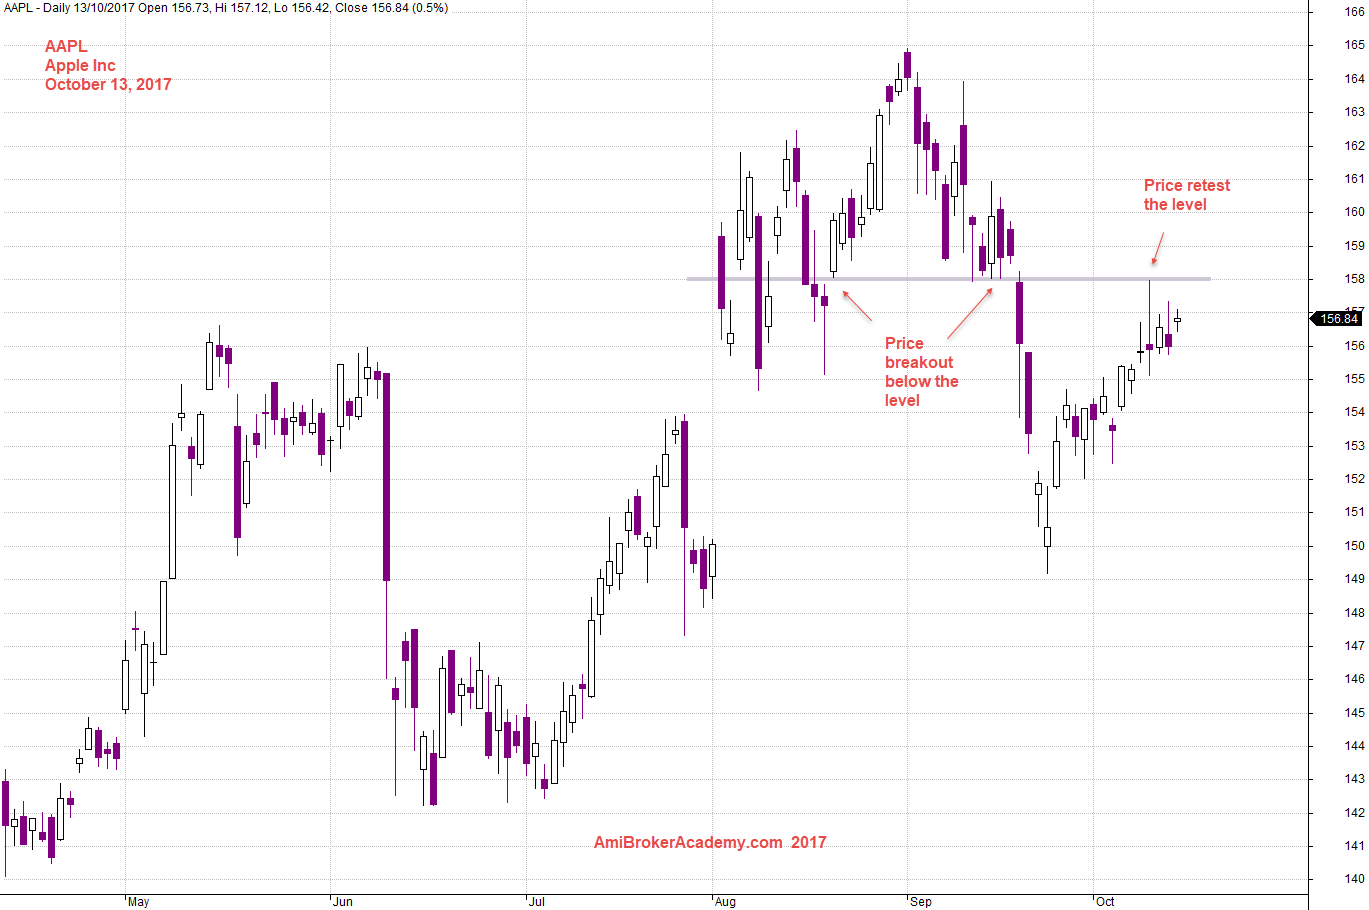
October 13, 2017 Apple Inc and Bar by Bar
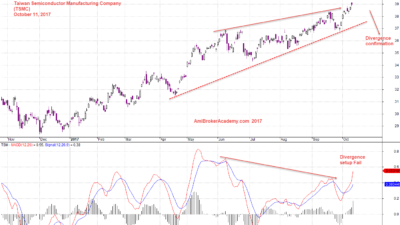
October 11, 2017 TSMC and MACD Divergence
TSMC Taiwan Semiconductor Manufacturing Company TSM and MACD Divergence
Picture worth a thousand words, see chart. The trend just keep going, going higher. See, only until the price close or breakout below the trendline. The reversal is not yet happening. So, wait.
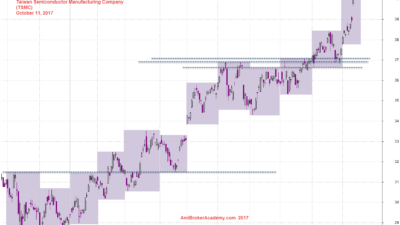
October 11, 2017 Taiwan Semiconductor Manufacturing Company aka TSMC and Support Resistance
TSMC Taiwan Semiconductor Manufacturing Company TSM and Support Resistance
Support Resistance is the most basic approach in technical analysis, however, it is not easy for many trader to draw the SR. Over here, we like to use the month high and month low as a reference for support resistance. To be true, there is no right no wrong in trading. As you as you follow a rule you set for yourself and stay with the rule, and you will be consistent. It is important for trader to stay consitant, if is either you are wrong, and you are wrong consistently or you are right consistently.
Microsoft Corp MSFT and MACD Divergence Setup Fail | AmiBrokerAcademy.com
IBM International Business Machines and MACD Divergence | AmiBrokerAcademy.com
Moses
AmiBrokerAcademy.com
Disclaimer
The above result is for illustration purpose. It is not meant to be used for buy or sell decision. We do not recommend any particular stocks. If particular stocks of such are mentioned, they are meant as demonstration of Amibroker as a powerful charting software and MACD. Amibroker can program to scan the stocks for buy and sell signals.
These are script generated signals. Not all scan results are shown here. The MACD signal should use with price action. Users must understand what MACD and price action are all about before using them. If necessary you should attend a course to learn more on Technical Analysis (TA) and Moving Average Convergence Divergence, MACD.
Once again, the website does not guarantee any results or investment return based on the information and instruction you have read here. It should be used as learning aids only and if you decide to trade real money, all trading decision should be your own.