December 27, 2017
Moses Stock Analysis
Singapore Stock – IX Biopharma Weekly and 34 EMA Wave
The chart show the stock price from August 2015 through to December 23 2016. Picture worth a thousand words. 34 EMA Wave has added a great visual effect. You could easily understand the stock is in bearish mode.
You could consider buy when the stock goes above 34 EMA bands.
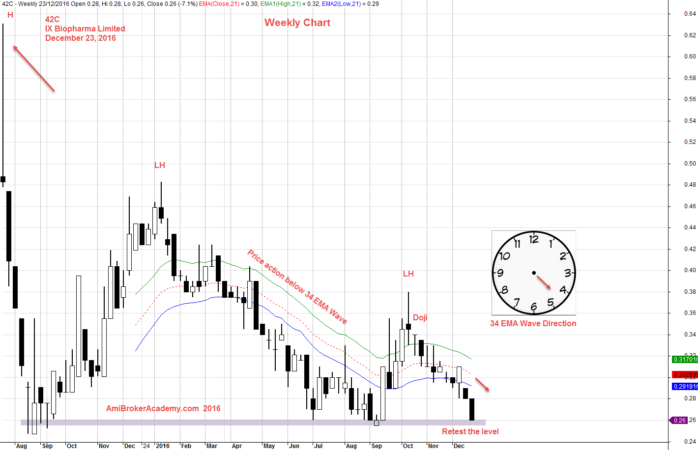
December 23, 2016 IX Biopharma Weekly
Moses Stock Desk
AmiBrokerAcademy.com
Disclaimer:
The discussion here is for educational purposes only. All information, data, symbols and trading ideas discussed hereby are the author or authors intend to demonstrate or illustrate purposes only. These are not recommendations or advice. It is not to be construed or intended as providing trading or legal advice.
Besides that this discussion is not an offer or solicitation of any kind in any jurisdiction where any AmiBrokerAcademy.com or its affiliate is try to do business.
Please note that active trading is not suitable for everyone. Any decisions you make about your trading or investment are important to you and your family, therefore should be made in consultation with a competent financial advisor or professional. We are not financial advisor and do not claim to be one.
Any views expressed here-in are not necessarily those held by amibrokeracademy.com.