July 29, 2017
52 Years Anniversary of Singapore Nation
5DM Ying Li International and Support Resistance
See chart for more, picture worth a thousand words.
Ying Li Share has formed a double top, thereafter the price breakout below the neckline. Support turns resistance.
Resistance get resisted again.
So, what will happen next? Think. Think things got more things. … Check the analysis that follows.
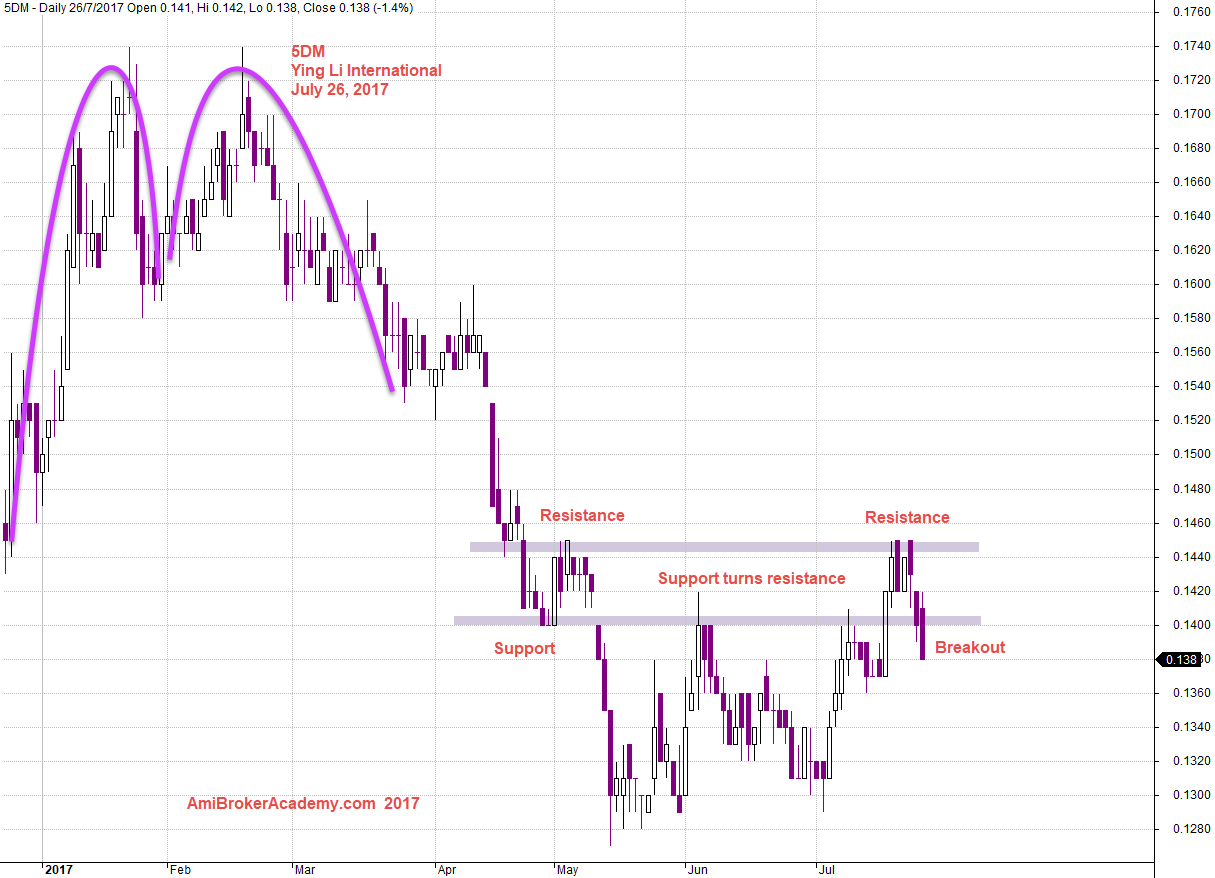
July 26, 2017 Ying Li International and Support Resistance
Ying Li International and Bear Flag
As we think things got more things. Channel slopping from bottom left to top right. Bullish bias. Picture worth a thousand words. But you have to study the context, if you will look further left, you see a flag pole. So, what is next? A possible bear flag is in progress.
Remember in trading, we are talking about probability. So be aware of the trend development.
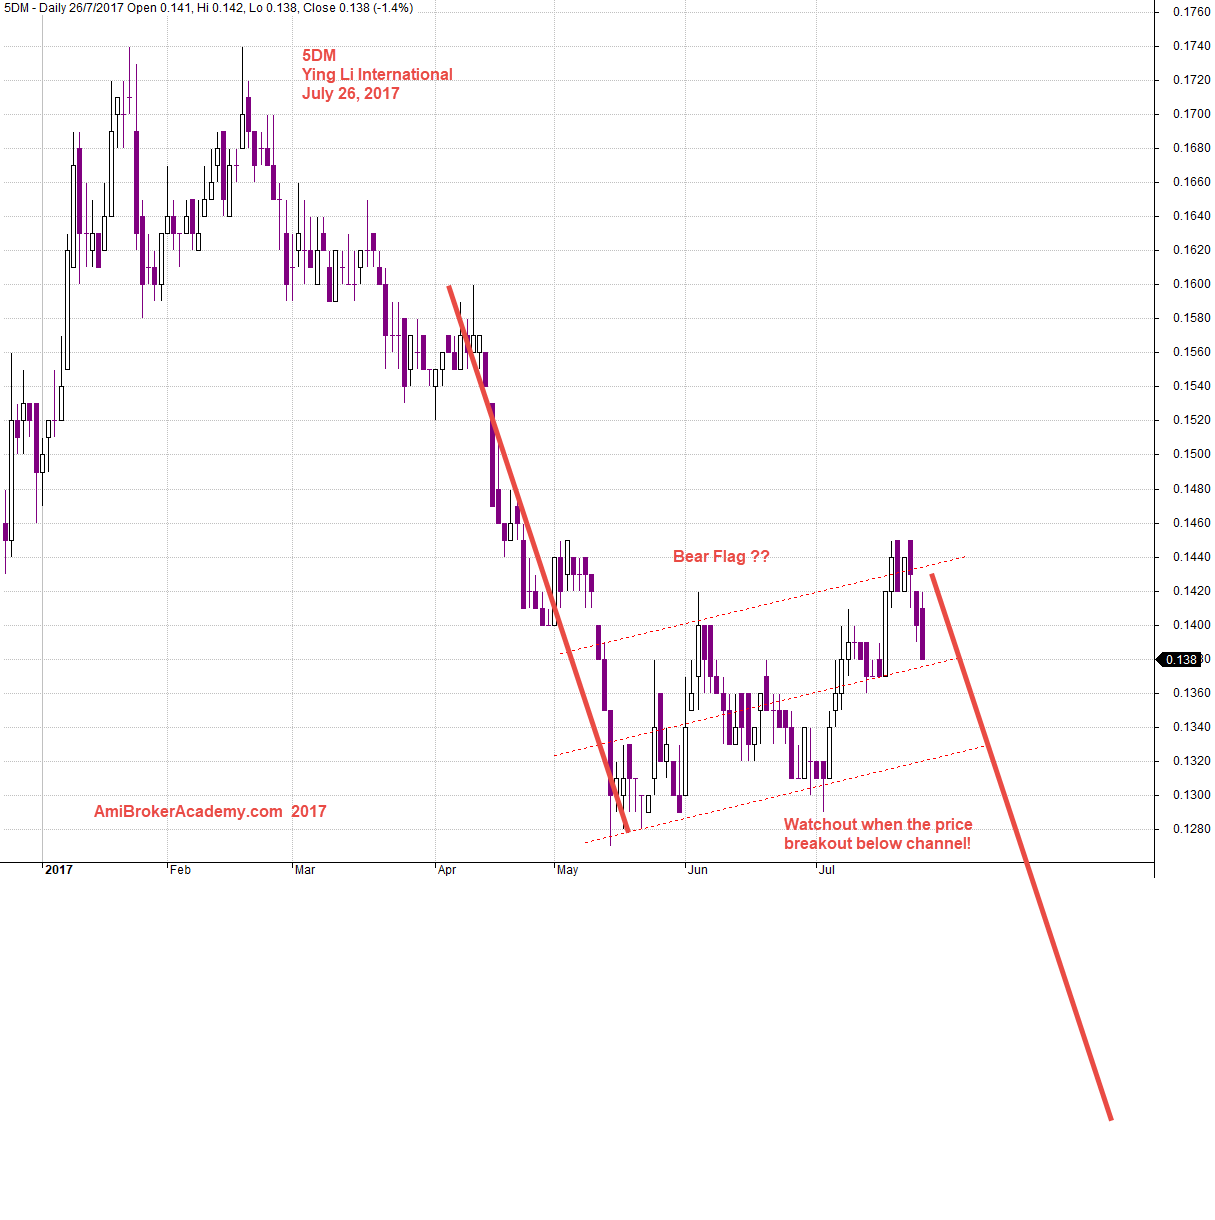
July 26, 2017 Ying Li International and Bear Flag
Riding Roller Coaster 5DM Ying Li International
See the share price, it is like riding the roller coaster. See chart for more.
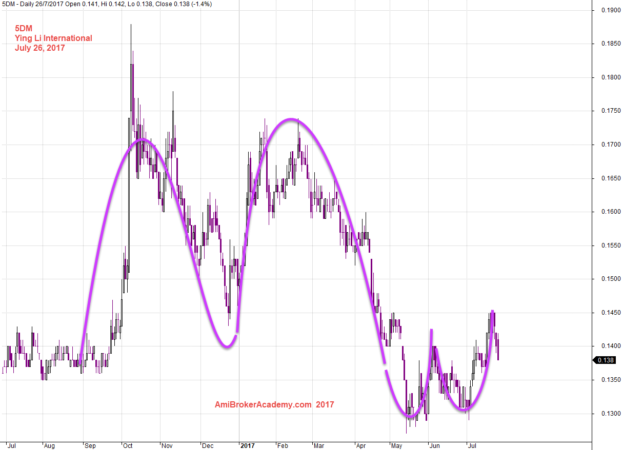
July 26, 2017 Ying Li International and Roller Coaster (curve)
5DM Ying Li International and MACD
Remember, we begin with our analysis in thinking that there is a possible developing a bear flag pattern.
However, MACD gives us a different perspective. the MACD has cross zeroline. MACD has cross up signal, MACD is currently in the possible, or bull bias zone.
Wait for few more days, as we see a MACD cross down is in progress. Of course, the MACD cross down could fail. …
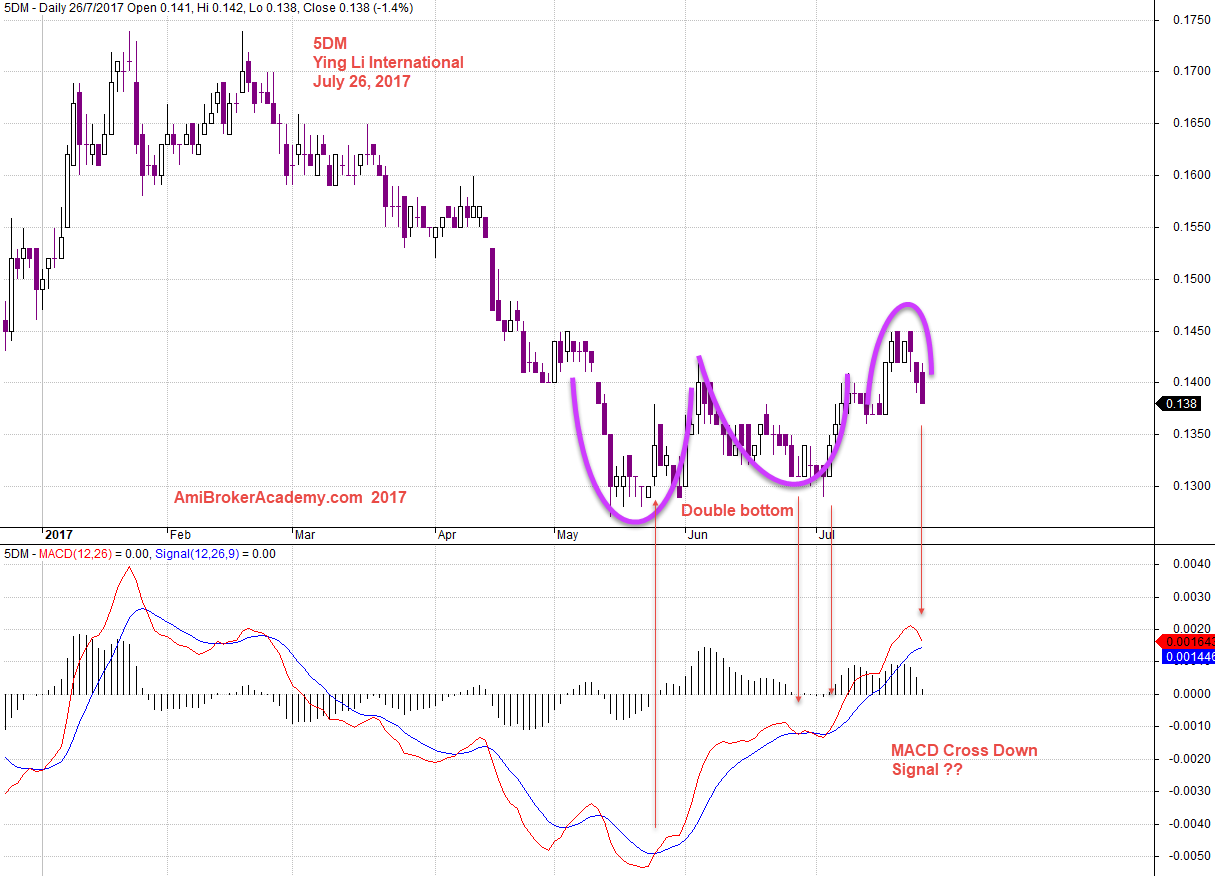
July 26, 2017 Ying Li International and MACD Signals
Remember, trading is all probability.
Thanks for visit the site here. You could also find free MACD scan here in this site too.
You can find other index analysis such as HSI, SSEC or Dow here. Check it out.
Moses
AmiBrokerAcademy.com
Disclaimer
The above result is for illustration purpose. It is not meant to be used for buy or sell decision. We do not recommend any particular stocks. If particular stocks of such are mentioned, they are meant as demonstration of Amibroker as a powerful charting software and MACD. Amibroker can program to scan the stocks for buy and sell signals.
These are script generated signals. Not all scan results are shown here. The MACD signal should use with price action. Users must understand what MACD and price action are all about before using them. If necessary you should attend a course to learn more on Technical Analysis (TA) and Moving Average Convergence Divergence, MACD.
Once again, the website does not guarantee any results or investment return based on the information and instruction you have read here. It should be used as learning aids only and if you decide to trade real money, all trading decision should be your own.