September 5, 2016
ABCD Chart Pattern, Moving Average, MACD Indicator are great charting tool. It helps to identify the price direction.
ABCD
Gartley Chart Pattern provides a clue where will the price move and may end. But all setup can fail.
Moving Average
When price action below moving average, we know that the price is bearish. It is a great advantage to short after the price has pullback near MA and resisted by MA.
MACD
When price forming lower low, and MACD or MACD Histogram is forming higher high. It signals the end of the down trend. Look out for buy opportunities.
Lenovo Group Stock Weekly Chart
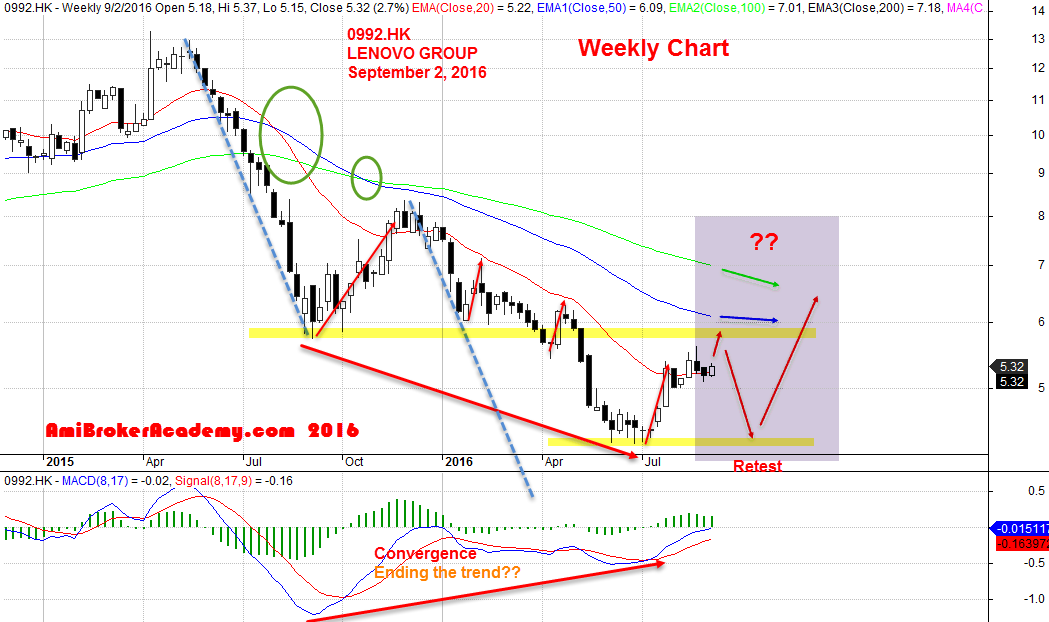
September 2, 2016 Lenovo Group Weekly Chart
Moses Hong Kong Stock Column
AmiBrokerAcademy.com
Disclaimer: All information, data and material contained, presented, or provided on amibrokeracademy.com is for educational purposes only. It is not to be construed or intended as providing trading or legal advice. Decisions you make about your trading or investment are important to you and your family, therefore should be made in consultation with a competent financial advisor or professional. We are not financial advisor and do not claim to be. Any views expressed here-in are not necessarily those held by amibrokeracademy.com. You are responsible for your trade decision and wealth being.