February 7, 2018
Who Leading Who?
Truly speaking, who leading who? Study the some of the Asia stock such as the example below, you will find the stock price has been come tumbling down well before last Friday. But remember no right no wrong. So what.
The phenomenon now is the whole world is shaking, everything is not steady at least for now. Anyone want to stick their heads out and shout no, not for my stock.
This is a cash flow world, no cash no talk. Many will want to cash in for the paper gain at least for now till when the sky is clearer. Watch your risk.
Catching the falling knife!?
Have not even see the true fall yet, and how to catch the falling knife.
Keep a monitoring watch first.
Hong Kong Stock Analysis
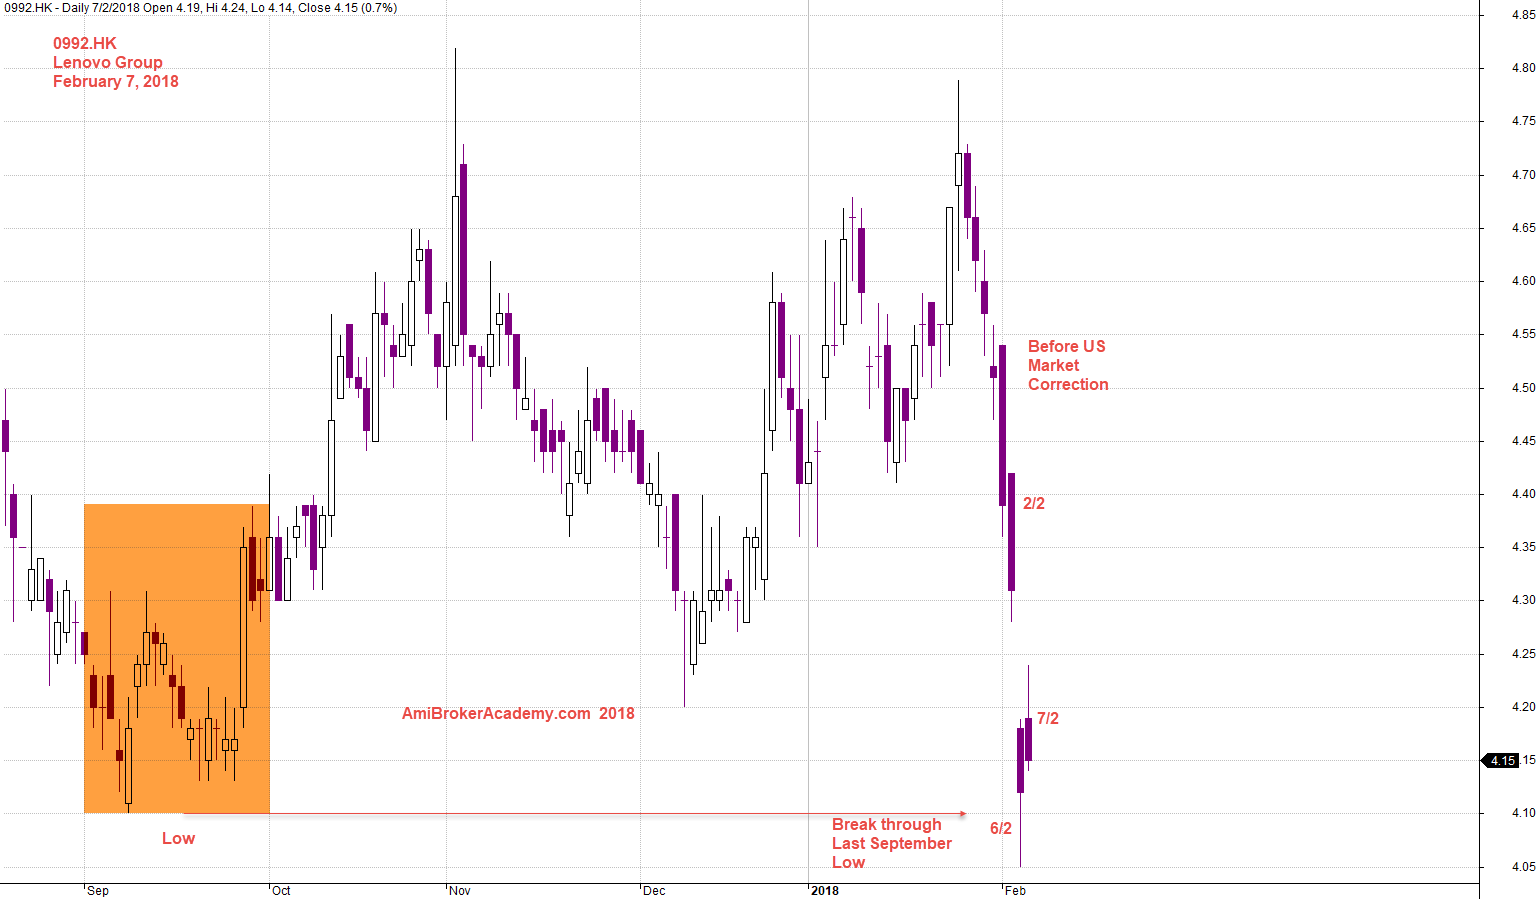
0992.HK Lenovo Group Charting
Major Newspaper across Asia reported the US stock markets correction resulting the deep for Asia markets. True or true. Let study the Lenovo stock, from the chart the stock started the deep even before the January month was over.
So, who leading who?!
Manage your risk!
In fact, the stock fail to break the last November high, the stock price begin to slide down, see chart not a slow one. It is a rapid speed down, from 4.80 down to near 4. A quick drop in less than eight candlesticks. Wow!
Powerful Chart Software – AmiBroker
The following chart is produced using AmiBroker charting software. It is a powerful chart software. You plot the stocks you are interested all in one chart, as long as you still could read them. See chart below.
February 7, 2018 Lenovo Group and Last Friday US Stock Market Correction
Moses
AmiBrokerAcademy.com
Disclaimer
The above result is for illustration purpose. It is not meant to be used for buy or sell decision. We do not recommend any particular stocks. If particular stocks of such are mentioned, they are meant as demonstration of Amibroker as a powerful charting software and MACD. Amibroker can program to scan the stocks for buy and sell signals.
These are script generated signals. Not all scan results are shown here. The MACD signal should use with price action. Users must understand what MACD and price action are all about before using them. If necessary you should attend a course to learn more on Technical Analysis (TA) and Moving Average Convergence Divergence, MACD.
Once again, the website does not guarantee any results or investment return based on the information and instruction you have read here. It should be used as learning aids only and if you decide to trade real money, all trading decision should be your own.