November 4, 2017
601006.SS Daqin Railway 大秦铁路 and Support Resistance
There are many ways to draw support resistance, like the example below we choose the yearly high and low as the levels for the support resistance. So, on the chart, you can see the price action is continuing testing the support for the last few years. It must be a very strong support. When it breaks, it will be a strong one. Be aware.
Stock listed in Shanghai Stock Exchange.
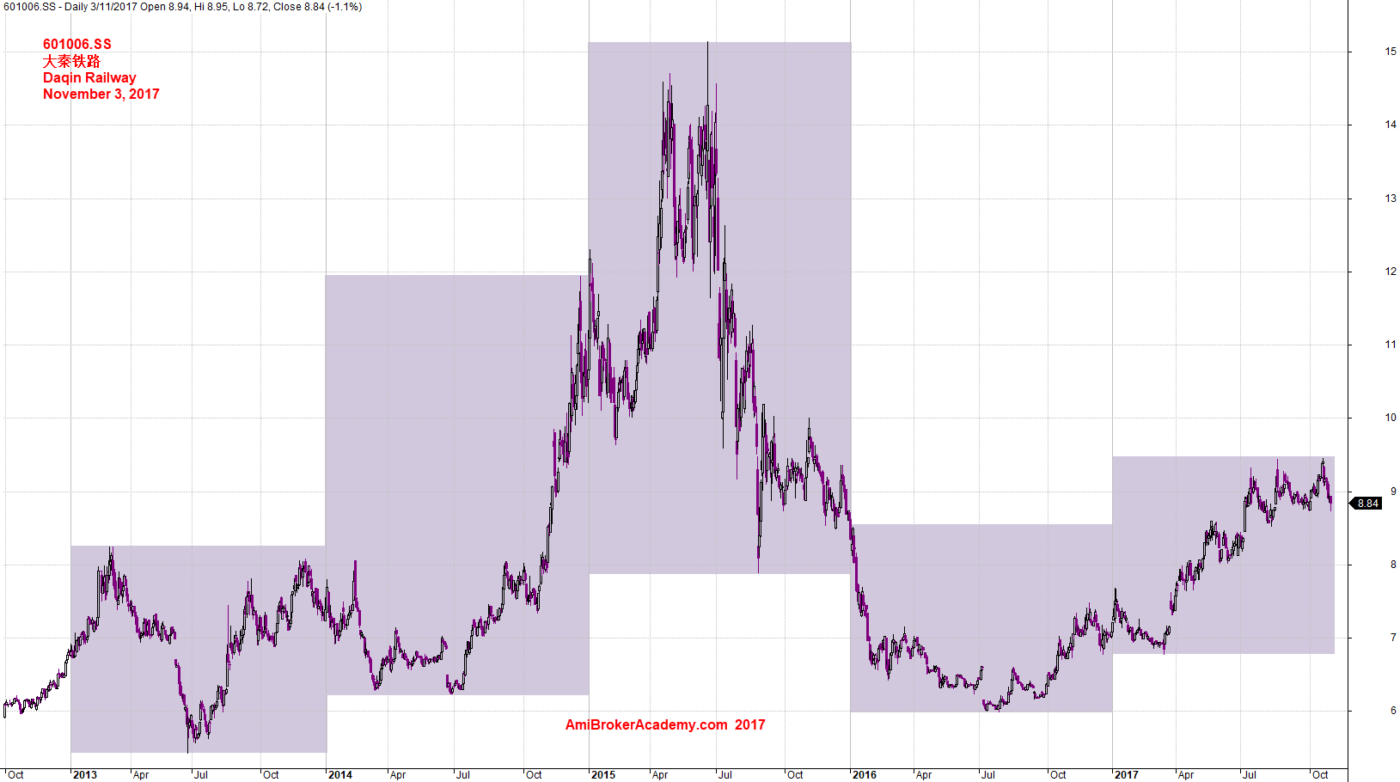
November 3, 2017 Daqin Railway and Year High Year Low
601006.SS and Trend
See chart for more.
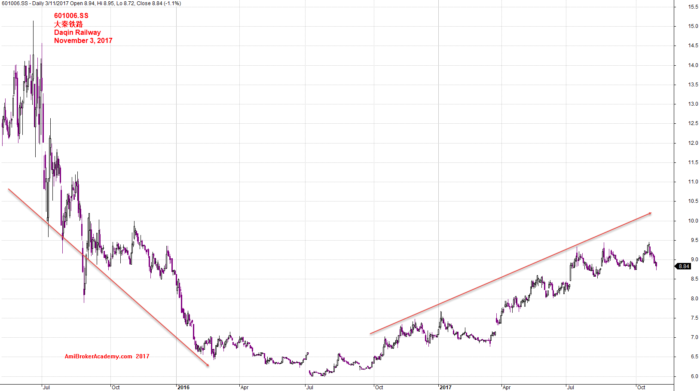
November 3, 2017 Daqin Railway and Trend
601006.SS Daqin Railway 大秦铁路 and MACD Divergence
See chart for more.
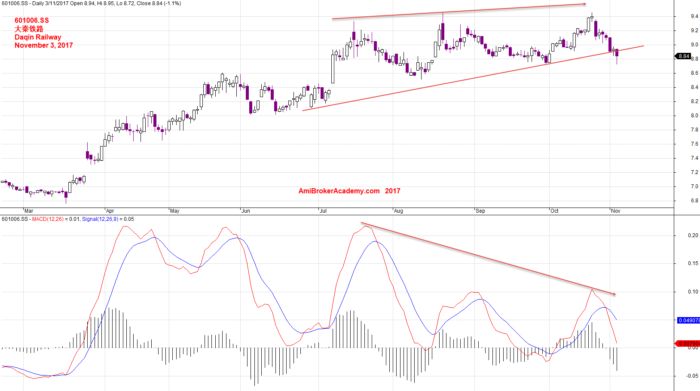
November 3, 2017 Daqin Railway and MACD Divergence
601006.SS Daqin Railway 大秦铁路 and MACD Breakout Strategy
See chart for more.
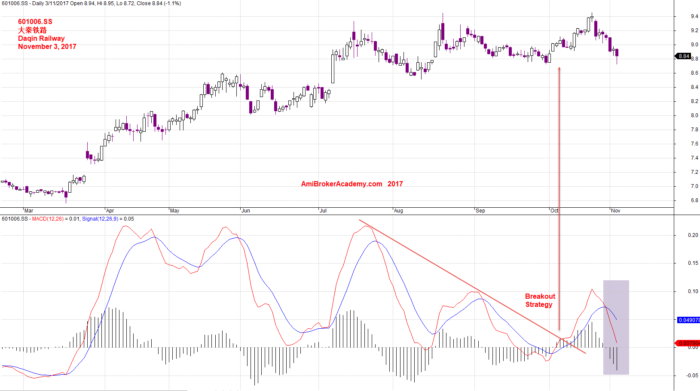
November 3, 2017 Daqin Railway and MACD Breakout Strategy
Moses
AmiBrokerAcademy.com
Disclaimer
The above result is for illustration purpose. It is not meant to be used for buy or sell decision. We do not recommend any particular stocks. If particular stocks of such are mentioned, they are meant as demonstration of Amibroker as a powerful charting software and MACD. Amibroker can program to scan the stocks for buy and sell signals.
These are script generated signals. Not all scan results are shown here. The MACD signal should use with price action. Users must understand what MACD and price action are all about before using them. If necessary you should attend a course to learn more on Technical Analysis (TA) and Moving Average Convergence Divergence, MACD.
Once again, the website does not guarantee any results or investment return based on the information and instruction you have read here. It should be used as learning aids only and if you decide to trade real money, all trading decision should be your own.