August 23, 2017
600095.SS Harbin High Tech and Resistance Turns Support
Picture worth a thousand words. Share price is moving in zigzag. The share price reach the bottom again; retest the low. The stock price bounces and resistance get resisted again. See chart for more.
Connecting the resistance. Connecting the support.
Support Resistance is the simpler and yet most difficult technical analysis to trade. Any point can be the support, any point can be the resistance. And how to determine which support or resistance to trade.
Human being tend to remember things in the past, so look for past support and resistance. See chart below, you will know what I mean.
Have fun!
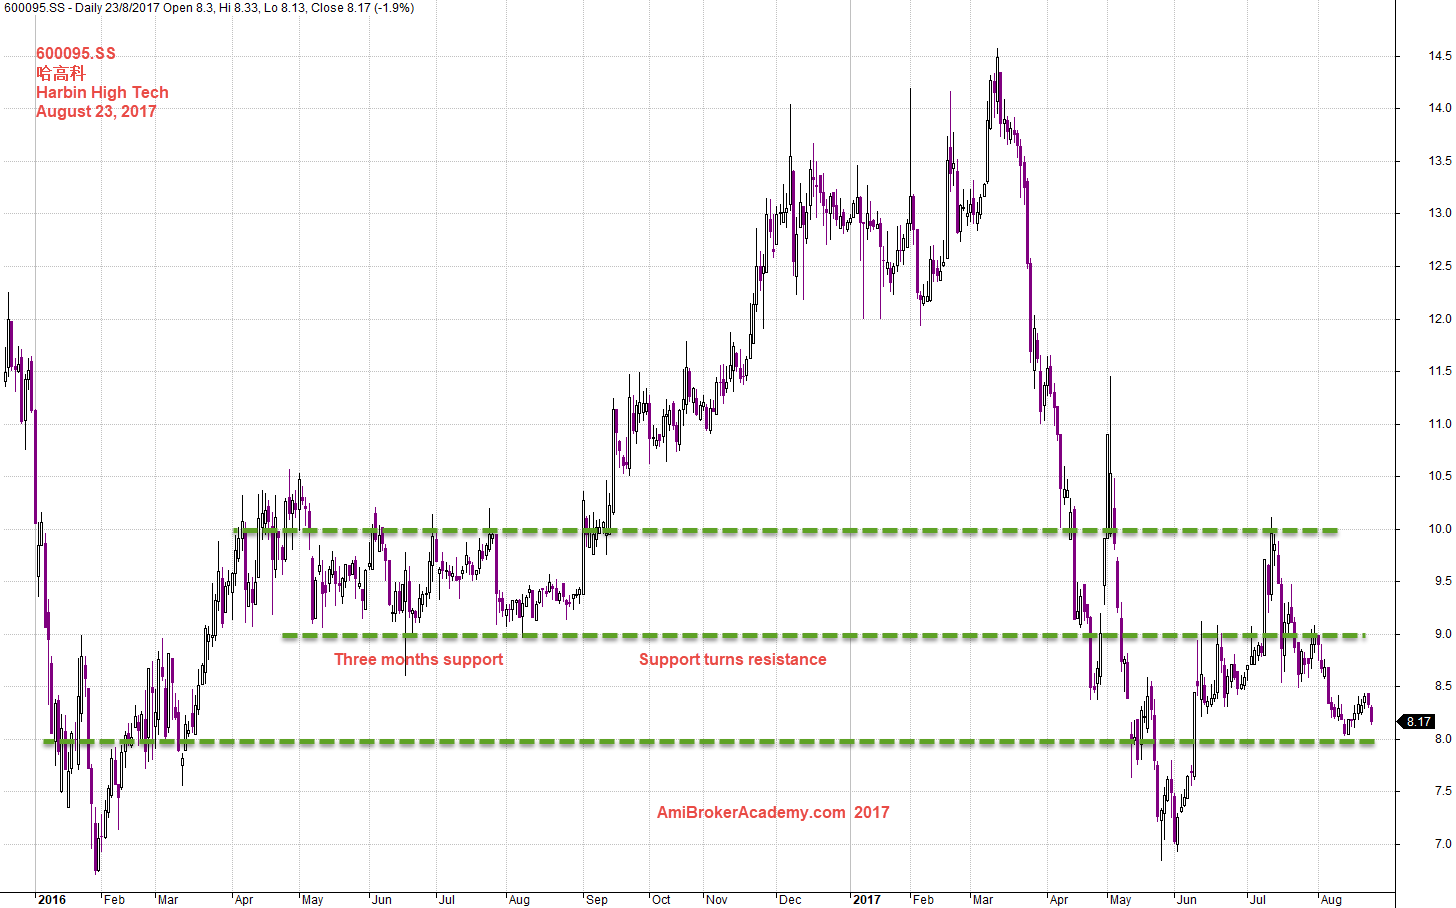
August 23, 2017 Harbin High Tech and Support Turns Resistance
600095.SS Harbin High Tech 哈高科 and 34 Moving Average Band
MA high, low and close create a band, or river. When MA slopping up, bullish, when MA slopping down bearish. Picture worth a thousand words. Price action zigzag over the MA band, and finally crosses below the band and stay below the ban until 2017 June, the price action finally crosses back up the MA band. But this is only a short time. Now the price action is going back down below the 34 MA band.
The 34 MA band is pointing to near three o’clock direction.
So, unless you are sure, buy is a try to catch the bottom. This is very risky, as so long as stock available, there would not be a shortage of share. In fact, although stock is limited on the issued shares, but catching the bottom assume when there is no stocks available the price will go up. … Not necessary.
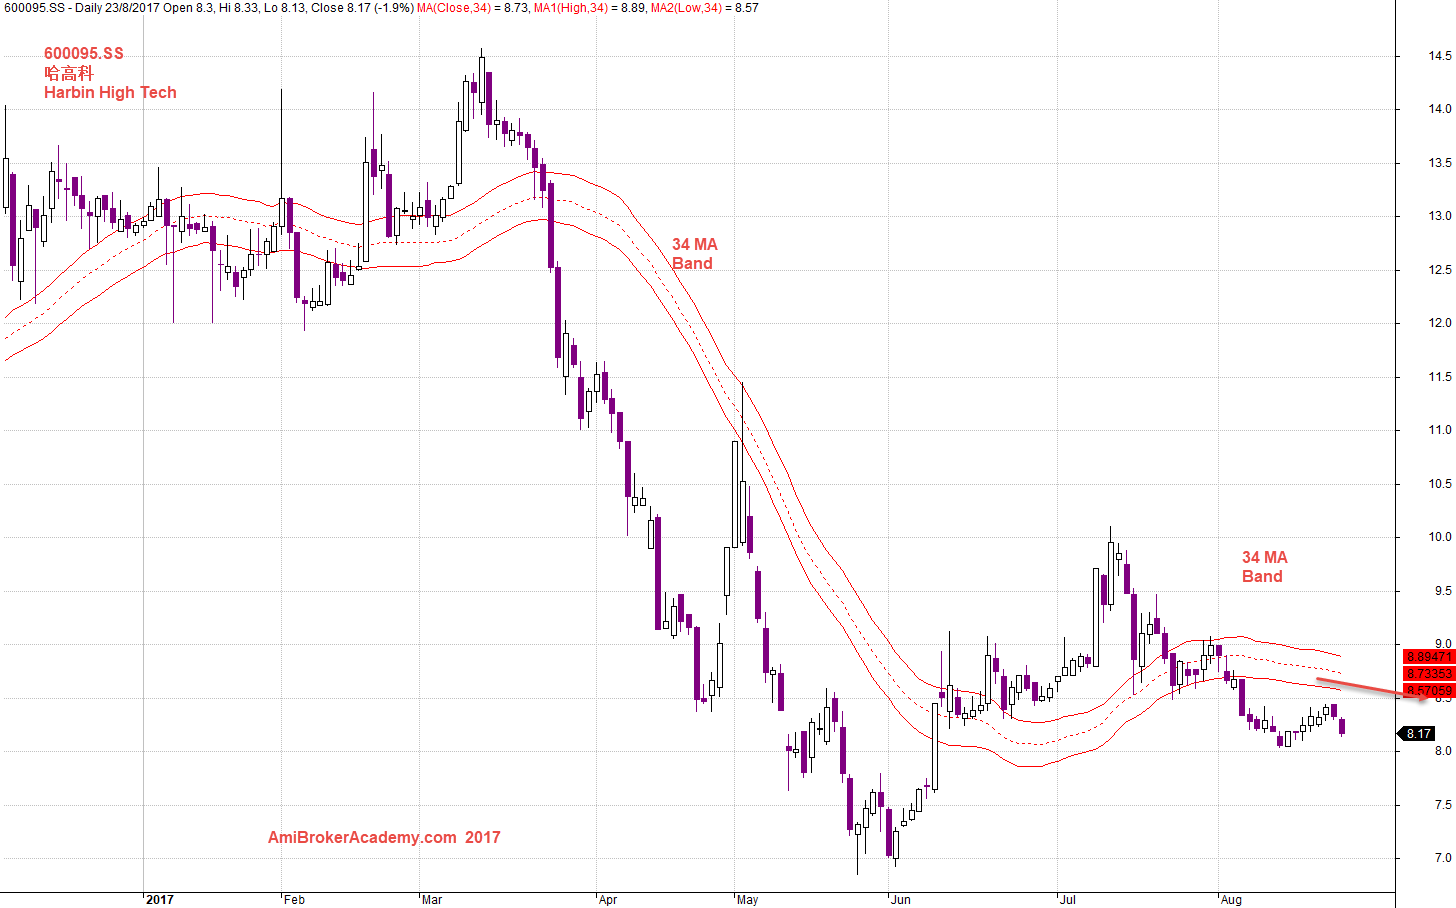
August 23, 2017 Harbin High Tech and 34 MA Band
600095.SS Harbin High Tech 哈高科 and Channel
See chart you can channels, channel traps the price action. Now, the price action has breakout of the channel.
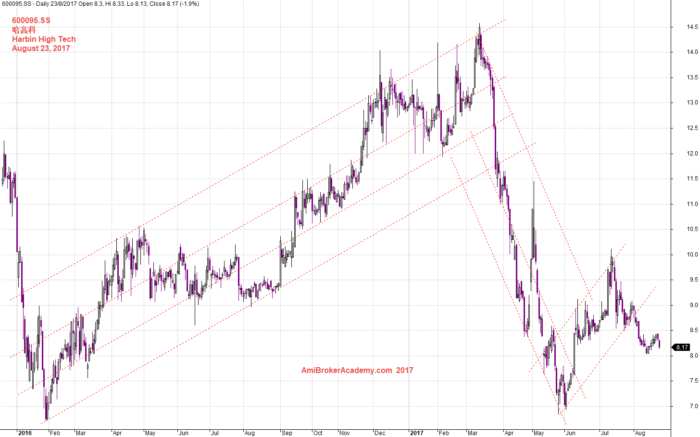
August 23, 2017 600095.SS Harbin High Tech 哈高科 and Channel
600095.SS Harbin High Tech 哈高科 and MACD Signals
See chart for more, the MACD does not give very obvious MACD signals.
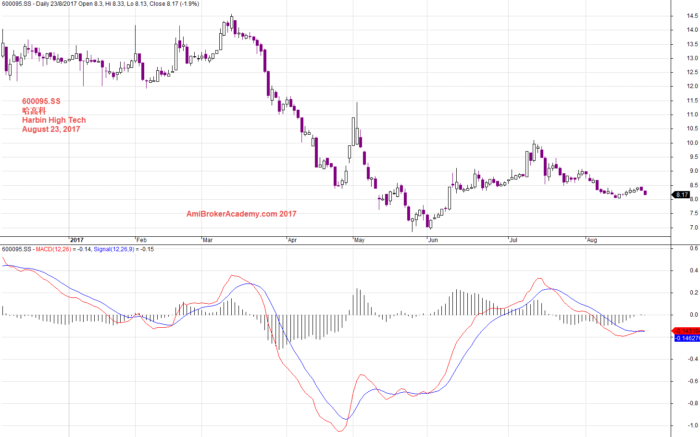
August 23, 2017 Harbin High Tech and MACD Signals
Thanks for visit the site here. You could also find free MACD scan here in this site too.
Moses
AmiBrokerAcademy.com
Disclaimer
The above result is for illustration purpose. It is not meant to be used for buy or sell decision. We do not recommend any particular stocks. If particular stocks of such are mentioned, they are meant as demonstration of Amibroker as a powerful charting software and MACD. Amibroker can program to scan the stocks for buy and sell signals.
These are script generated signals. Not all scan results are shown here. The MACD signal should use with price action. Users must understand what MACD and price action are all about before using them. If necessary you should attend a course to learn more on Technical Analysis (TA) and Moving Average Convergence Divergence, MACD.
Once again, the website does not guarantee any results or investment return based on the information and instruction you have read here. It should be used as learning aids only and if you decide to trade real money, all trading decision should be your own.